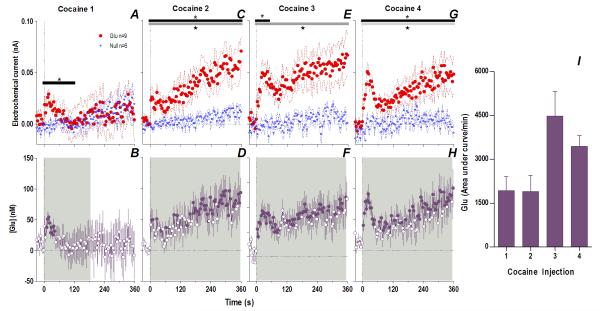
Fig. 1. An immediate, highly phasic Glu release induced by cocaine and its dramatic changes following repeated exposure.
Left top row shows mean (±SEM) changes in currents detected by Glu (red) and Glu0 (blue) sensors for each injection. Horizontal bars on this and all subsequent figures show the duration of significant main effect between Glu/Glu0 currents (black), or a significant Current × Time interaction (gray). The first injection (A) showed only a brief (118 s) interaction (F30,390=1.57 p<0.04) which progressively became greater and longer with each subsequent injection (C. 2: Glu/Glu0 [358 s, F1,13=7.99], interaction [358 s, F90,1170=1.68]; E. 3: Glu/Glu0 [358 s, F1,13=8.375], interaction [46s, F12,156=1.92]; G. 4: Glu/Glu0 [358 s, F1,13=9.00], interaction [358 s, F90,1170=1.34], all p<0.05). Left bottom row shows mean (±SEM) change in [Glu] (purple). Each successive injection resulted in a greater and more prolonged [Glu] response, where the shaded area in this and all subsequent figures shows duration of main effect (1-way RM ANOVA: B. 1: 186 s, F47,376=1.41; D. 2: 358 s, F90,720=2.69; F. 3: 358 s, F90,720=1.63 H. 4: 358 s, F90,720=2.49, all p<0.05). Filled symbols are values significantly different from baseline (PLSD post-hoc). Vertical hatched lines in this and all subsequent figures show the injection start. Right panel (I) compares the area under the curve of [Glu] for the first min after each injection. The total [Glu] released for this period differed significantly between Day 1 (Injection 1-2) and Day 2 (Injection 3-4), (mixed-factor ANOVA F1,16=12.18 p<0.05).

