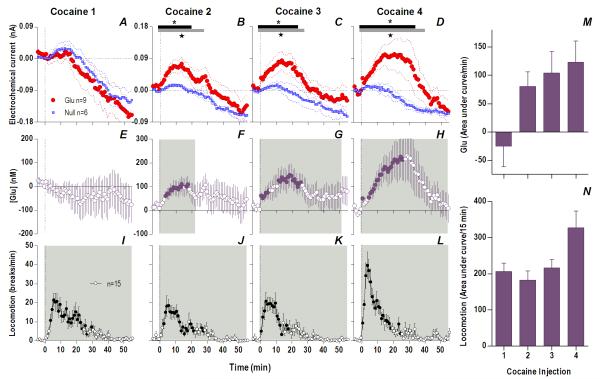
Fig. 3. The appearance of an increasing and persistent Glu release following repeated cocaine exposure.
Top left row shows mean (±SEM) current changes detected by Glu (red) and Glu0 (blue) sensors. Middle left row shows mean (±SEM) change in [Glu] (purple). While the first cocaine injection resulted in no significant difference in Glu/Glu0 currents (A) and [Glu] (E), each successive injection resulted in a greater and more prolonged difference in Glu/Glu0 currents [2: Glu/Glu0 (gray bars; 27 min, F1,13=4.68), interaction (black bars; 19 min, F19,247=1.69); 3: Glu/Glu0 (27 min, F1,13=4.68), interaction (23 min, F23,299=1.67); 4: Glu/Glu0 (39 min, F1,13=4.73), interaction (33 min, F33,429=1.55), all p<0.05], and greater [Glu] release (2: 23 min, F23,184=1.69; 3: 51 min, F51,416=1.38; 4: 56 min, F56,440=2.59), all p<0.05. Bottom left row shows mean (±SEM) changes in locomotion (shaded area, duration of main effect 1: F56,784=6.43; 2: F56,784=6.74; 3: F56,784=7.29; 4: F56,784=12.79, all p<0.001). Filled symbols are values significantly larger than baseline (PLSD post-hoc). M summarizes mean increases in [Glu] across rats for the significant duration of drug effect and N shows locomotion for 15 min post-injection (as area under curve). There were significant increases in [Glu] (mixed-factor ANOVA: Day, F1,16=4.89, Injection × Day, F1,16=4.64,) and locomotion (Day, F1,28=5.61, Injection × Day F1,28=5.02) all p<0.05.

