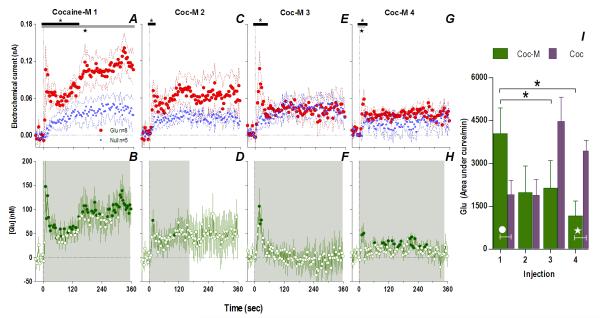
Fig. 4. Peripherally acting cocaine-methiodide induces rapid Glu release that rapidly habituates following repeated exposure.
While cocaine-M initially resulted in different Glu (red)/Glu0 (blue) currents (A. Glu/Glu0 main effect [gray bar: 358 s/n=91, F1,11=6.61], interaction [black bar: 138 s, F35,385=1.48], both p<0.05) and rapid [Glu] release (B. shaded area, duration of main effect [358 s, F90,630=1.48 p<0.001]), this effect rapidly habituated with each next injection (Glu/Glu0 interaction 2: [18 s, F5,55=2.54]; 3: [46s, F12,132=1.90]; 4: [26 s, F7,77=2.21] all p<0.05) so that [Glu] release was less (1: [358 s, F90,630=1.48]; 2: [166 s, F42,294=1.43]; 3: [358 s, F90,630=2.08] 4: [350 s, F88,616=1.31] all p<0.05). Filled symbols are values significantly different from baseline (PLSD post-hoc). Right panel (I) summarizes this decreased effect of cocaine-M as the area under the curve of [Glu] for the first min after each injection (green bars, 1-way RM ANOVA, F3,21=3.93 p<0.05, * indicates cocaine-M injections that were significantly different, p<0.05). Similar data for cocaine (purple bars) are shown for comparison. Although the first two injections across treatments did not show overall significant differences (2-way RM ANOVA, ns), this is due to opposite changes with each drug. For the 1st injection, [Glu] was larger for cocaine-M than cocaine HCl (white circle, t15=2.15 p<0.03) but for the last injection changes were opposite (white star, planned comparison t15=3.64 with Bonferroni correction for multiple comparisons, α=0.0125, p<0.002).

