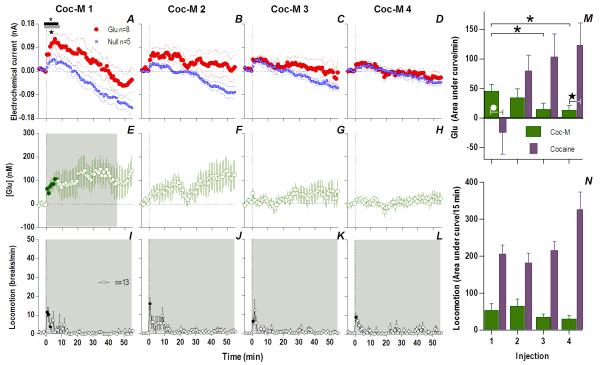
Fig. 5. Repeated injections of cocaine-M show marked habituation in tonic Glu release.
While the first cocaine-M injection (A) resulted in different Glu (red)/Glu0 (blue) currents, this effect was short (Glu/Glu0 [gray bar]: 8 min, F1,11=5.26, interaction [black bar]: 7 min, F7,77=2.32, both p<0.05) and not significant for later injections (B-D). [Glu] release was significant only for the first cocaine-M injection (individual points significantly different from baseline (filled symbols) within the period of a main effect [shaded area, 46 min, F46,322=1.43 p<0.05]). M summarizes mean increases in [Glu] per minute for the significant duration of drug effect; effect of cocaine-M decreased with each injection (F3,21=3.47 p<0.04, asterisks show individual significant decreases, p<0.05). When compared with cocaine, there was a significant Treatment × Injection interaction between the first two injections of cocaine-M and cocaine (2-way RM ANOVA, F1,15=13.6 p<0.05), injection was almost significant p=0.07. Glu response to the 1st injection of cocaine-M was greater than that for cocaine (white circle; p<0.05, PLSD post-hoc test). Star shows a significant difference between the 4th injection of cocaine and cocaine-M (planned comparison t15=2.70 with Bonferroni correction for multiple comparisons, α=0.0125, p<0.008). Bottom left row shows mean (±SEM) changes in locomotion. While cocaine-M induced a weak increase in locomotion (main effect: 1: F56,672=2.73; 2: F56,672=2.75; 3: F56,672=2.53, 4: F56,672=2.0, all p<0.05), this response did not differ across injections (N). Cocaine-induced locomotion is shown for comparison.

