
Fig. 2.
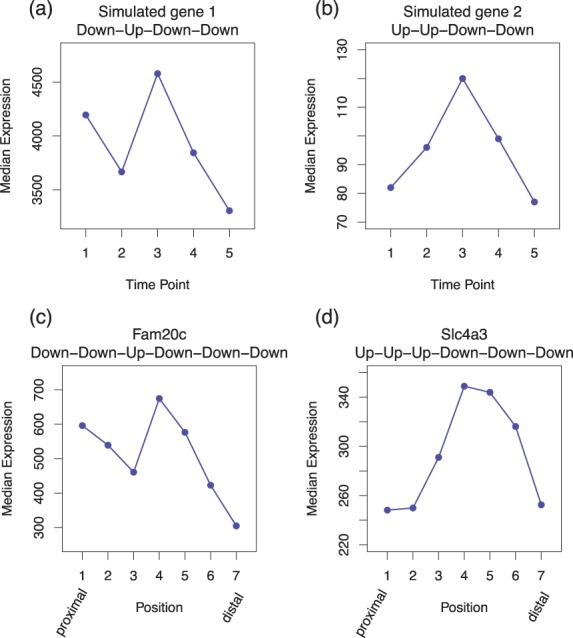
Shown are two genes identified exclusively by EBSeq-HMM in Sim I data (upper) and in case study data (lower). The x-axis shows time points (upper) and positions on mouse limb (lower), and the y-axis shows median gene expression adjusted for library sizes