
Fig. 4.
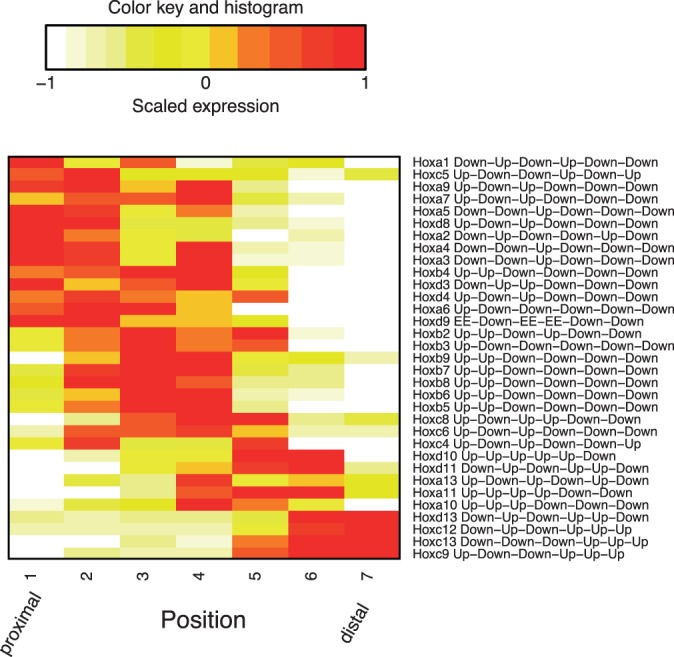
Shown are median expression levels of 33 Hox genes identified as DE by EBSeq-HMM. The expression values were adjusted for library size and further scaled to mean 0 and standard deviation 1 for each gene; median expression over three replicates is shown. Genes were clustered via hierarchical clustering using Euclidean distance and complete linkage. The x-axis shows seven positions over the mouse limb