
Fig. 5.
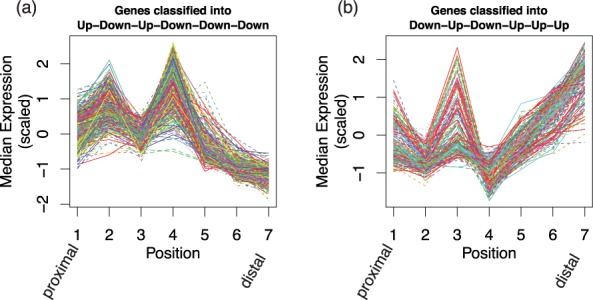
(a), (b) Shown are genes classified as following an Up-Down-Up-Down-Down-Down (left panel, 827 genes) or Down-Up-Down-Up-Up-Up (right panel, 218 genes) expression path in the case study data. Each line indicates one gene. The x-axis shows seven positions over the mouse limb; the y-axis shows median scaled expression within each position