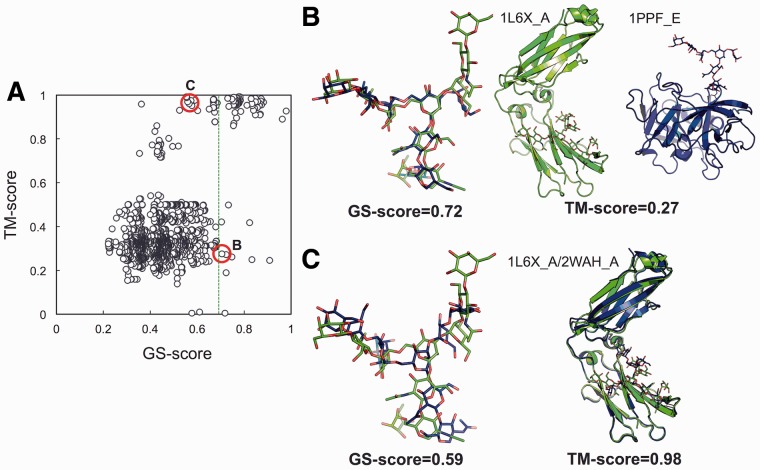
Fig. 5.
Comparison of glycan similarity (GS-score) with glycoprotein similarity (TM-score) through PDB N-glycan library search. (A) TM-score versus GS-score plot. All PDB N-glycans and their parent proteins were structurally compared with the target glycan and its parent glycoprotein (PDB:1L6X_A), respectively. The green dotted line indicates a GS-score (0.69) whose P-value is 1 × 10⁻³. (B) An example where proteins show distinct folds, but the GS-score between their glycans is high. (C) An example where proteins show similar global folds, but the GS-score between their glycans is low. In these examples, the two pairs of glycans have the identical coverage (0.8)

