
Figure 5.
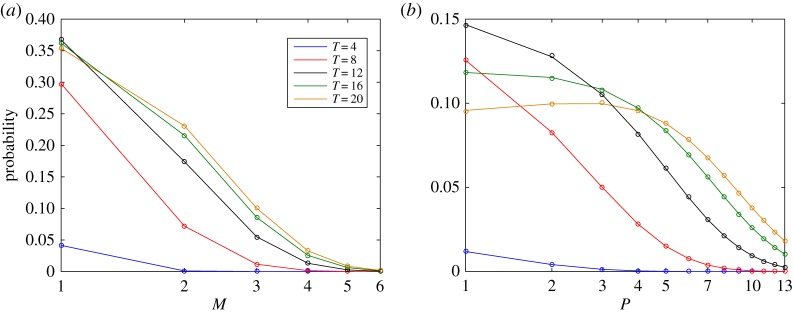
Probability distributions (with logarithmic scale on the x-axis) for the number of (a) M and (b) P molecules at time points T=4,8,12,16 and 20. DCME solutions are drawn as solid lines. Probabilities obtained from 1 000 000 SSA runs are shown as dots. Both solutions match perfectly.