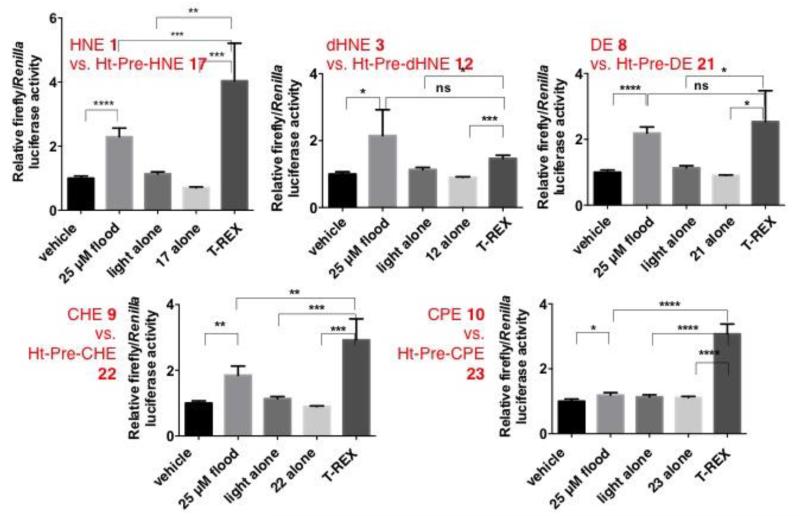
Figure 10.
Reporter gene assay data on ARE upregulation in HEK-293 cells stably expressing Halo-Keap1 and transiently expressing Nrf2 alongside ARE-inducible firefly luciferase and constitutive Renilla luciferase. For each LDE, the magnitude of ARE induction is compared between T-REX conditions and whole-cell electrophile (25 μM) flooding. Vehicle, DMSO. See also Figure S6–S7 and S13 for titration of ARE response and cell viability analyses. Error bars designate S.D. over 3 independent biological replicates. The ARE response was analyzed after 18 h incubation period post 20-min light exposure.

