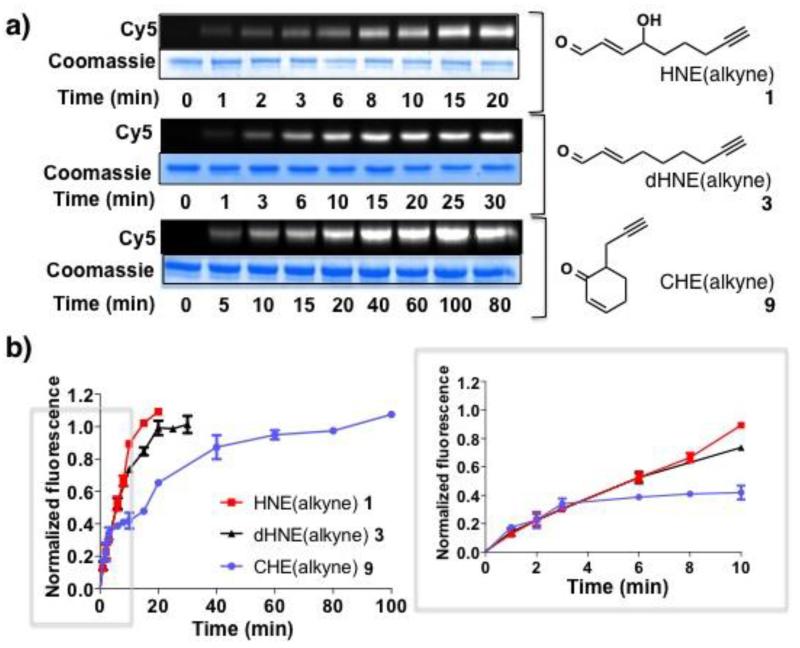
Figure 5.
(a) Representative in-gel fluorescence data for the time-dependent alkylation of recombinant human His6-Keap1 with 1, 3, and 9. (b) Quantitation of the data in (a) (n = 2) as progress curve plots. Inset shows the first 10 min. The “normalized fluorescence” was derived by first calculating the ratio of Cy5 : Coomassie signals for each time point, and normalizing the resultant values to the respective mean of the last three time points for each LDE.

