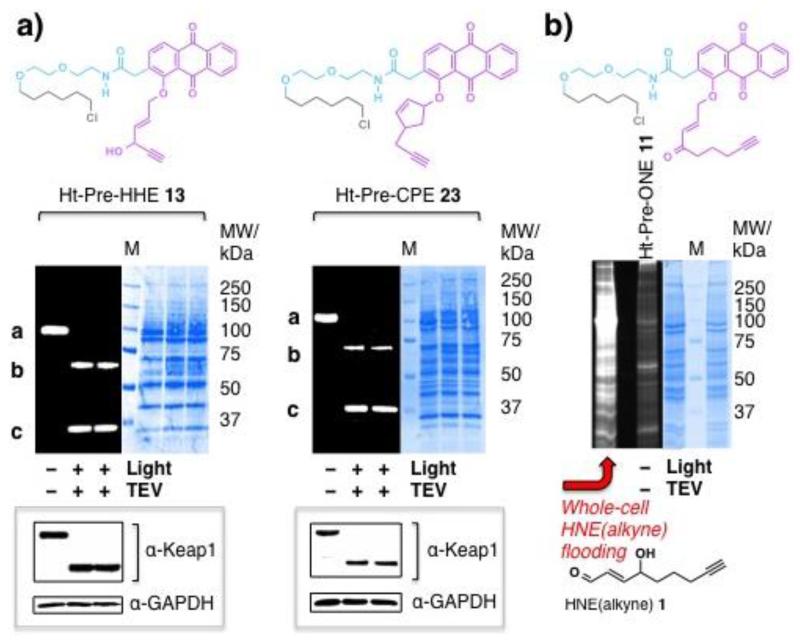
Figure 6.
(a) Representative data for T-REX-assisted Keap1-specific electrophilic adduction (a) vs. whole-cell electrophile flooding (b). (a) Live HEK-293 cells stably expressing Halo-Keap1 were treated with 25 μM 13 and 23, and the excess washed out. After 20-min light exposure, cells were lysed, and the lysate was treated with TEV-protease (separating Halo and Keap1), followed by Cy5 click assay reagents. Band a, Halo–Keap1 (104 kDa), b, Keap1 (70 kDa, post TEV cleavage), c, Halo (33 kDa). Dark gel is the fluorescence gel of the Coomassie-stained PVDF membrane on the right. Independent duplicates are shown for light-activated TEV-treated samples. “M” indicates the ladder lane. Insets show western blot. See also Figure S2, Table 1, and Eq. 1. (b) Whole-cell HNE 1 (25 μM) treatment target non-specifically. Ht-Pre-ONE 11 reacts before uncaging.

