
Fig. 4.
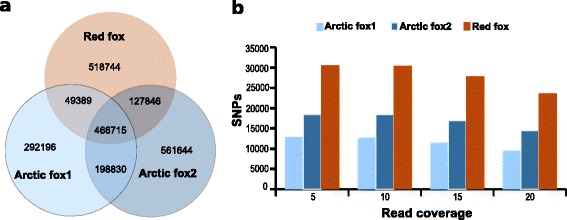
Comparative nucleotide differences (single variable sites) in the three fox individuals. a Venn diagram showing the number of variable sites for each of the three fox samples compared to the dog genome, and the degree of shared variable sites among the three foxes. b Frequency of heterozygous sites (intra-individual SNPs) in the three fox individuals at different read coverages (5,10,15 and 20)