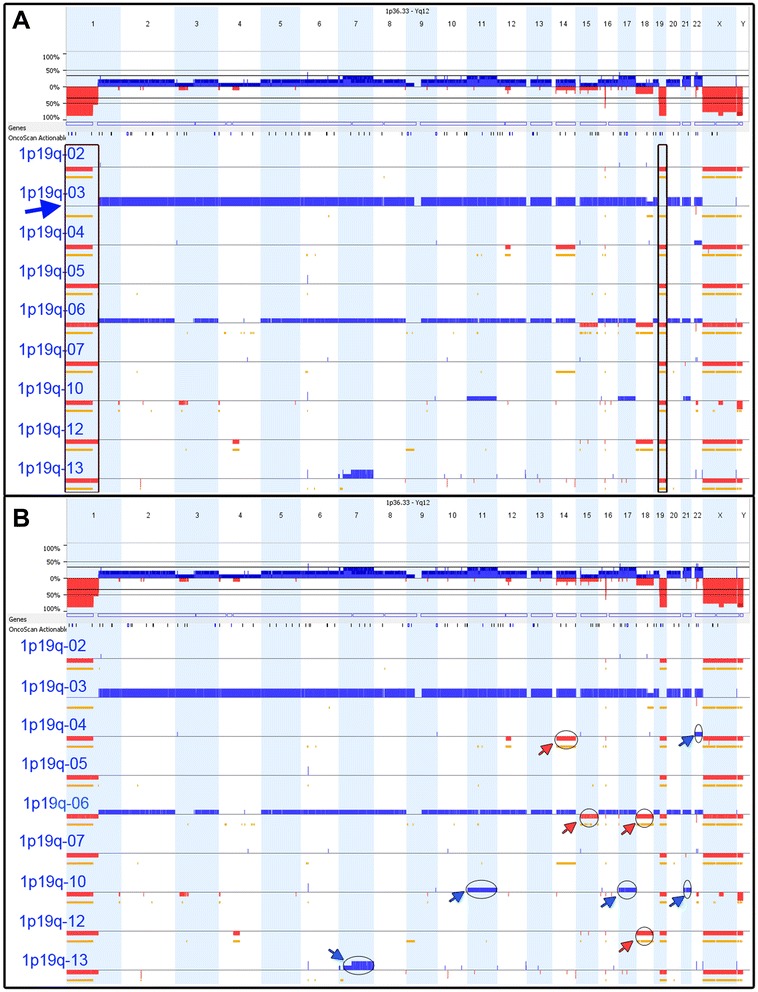
Fig. 1.

1p19q co-deletion cohort. a Highlights the 1p and 19q co-deletions (deletions marked by indicated region). Case 1p19q-03 had two copies of 1p and 19q, but was tetraploid throughout the remainder of the genome (blue arrow). b Highlights whole chromosomal changes observed in this cohort including gains (blue arrows) and deletions (red arrows)
