Figure 8.
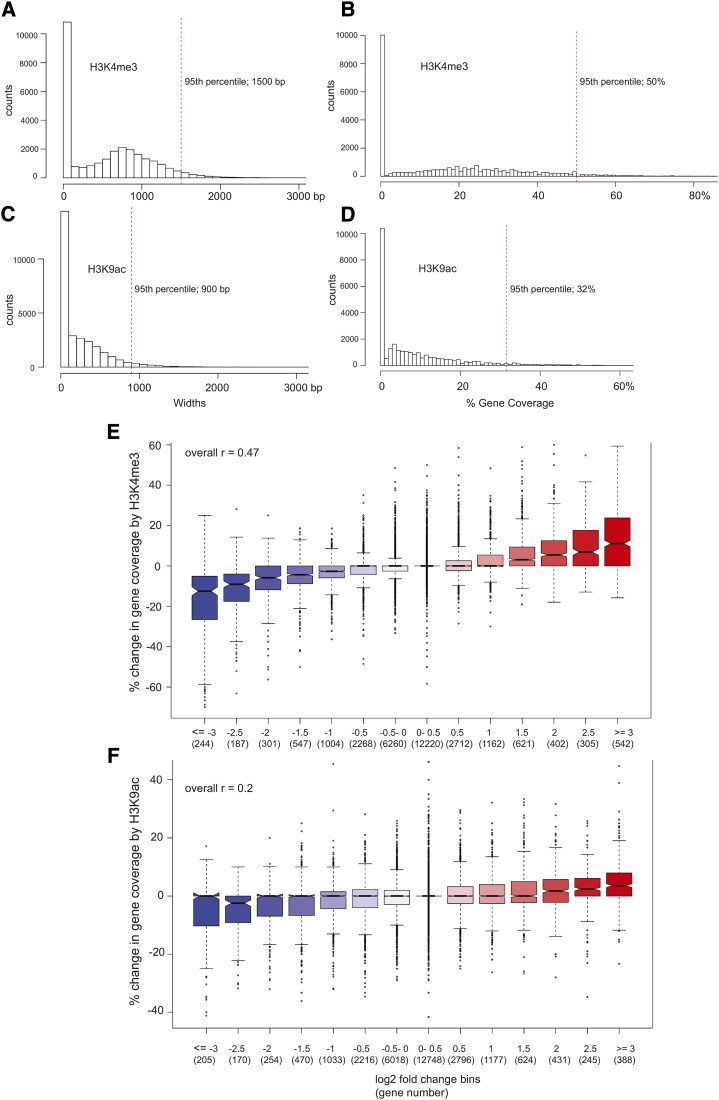
Breadth of histone modifications and gene expression during leaf senescence. The breadth of H3K4me3 modifications for 42-d samples are shown according to base pairs covered (A) or percentage of gene covered (B). The breadth of H3K9ac modifications for 42-d samples are shown according to base pair covered (C) or percentage of gene covered (D). Red dashed vertical lines delineate the top 95th percentile. E, The percentage change in H3K4me3 gene coverage from 29 to 57 d is plotted for gene expression bins. Genes are placed in bins according to the fold change in gene expression over the same time interval. Gene counts per bin are given in parentheses. For example, the bin labeled 0.5 includes 2,712 genes that display a log2 increase in gene expression greater than 0.5 to less than or equal to 1.0. The box plot representations are as described in Figure 1E. The overall Pearson correlation between percentage change in gene coverage and fold change in gene expression was 0.47 (upper left corner), with a 95% confidence interval of 0.463 to 0.481 (P < 2.2E-16). F, The percentage change in H3K9ac gene coverage from 30 to 42 d is plotted similarly to A, except that the expression time interval is from 29 to 42 d to better correspond to the H3K9ac time interval. The overall Pearson correlation in this case was 0.20, with a 95% confidence interval of 0.185 to 0.207 (P < 2.2E-16).

