Figure 1.
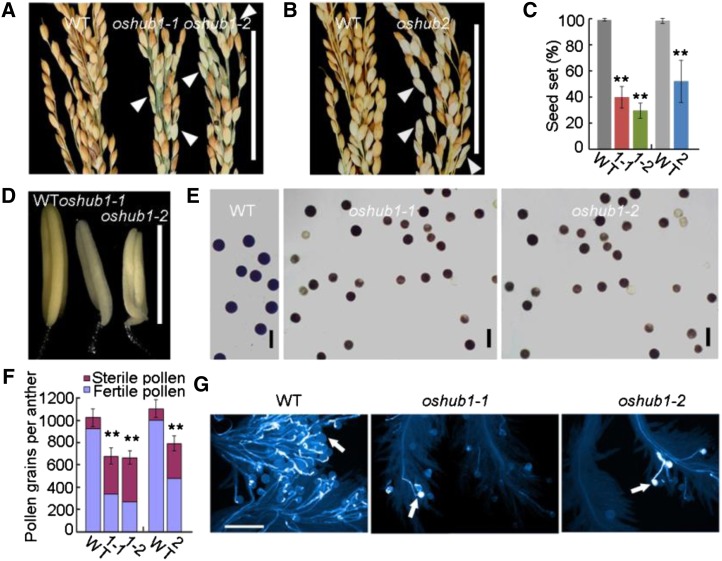
Phenotypic analysis of the wild type (WT) and oshub1 and oshub2 mutants. A, Comparison of the percentage seed set of the wild type (left), oshub1-1 (middle), and oshub1-2 (right). B, Comparison of the percentage seed set of the wild type (left) and oshub2 (right). Arrowheads in A and B indicate sterile spikelets. C, Seed set of wild-type and oshub1-1 (1-1), oshub1-2 (1-2), and oshub2 (2) mutant plants. Seed set was calculated as the proportion of fertile spikelets to all spikelets for each plant at maturity. Data are means ± sd (n = 20). D and E, Comparison of anther phenotype before anthesis (D) and I2-KI-stained pollens (E) of the wild type and oshub1 mutants. F, The number of sterile and fertile pollen grains per anther as determined by I2-KI staining of wild-type, oshub1-1 (1-1), oshub1-2 (1-2), and oshub2 (2) materials. Data are means ± sd of total pollen grains (n = 5). G, Comparison of aniline blue-stained pollen grains on stigmas for the wild type and oshub1 mutants. Arrows indicate the pollen grains with pollen tubes. Student’s t test was used to analyze significant differences between the wild type and mutants (*P < 0.05; and **P < 0.01). Bars = 5 cm (A and B), 2 mm (D), 50 µm (E), and 200 µm (G).

