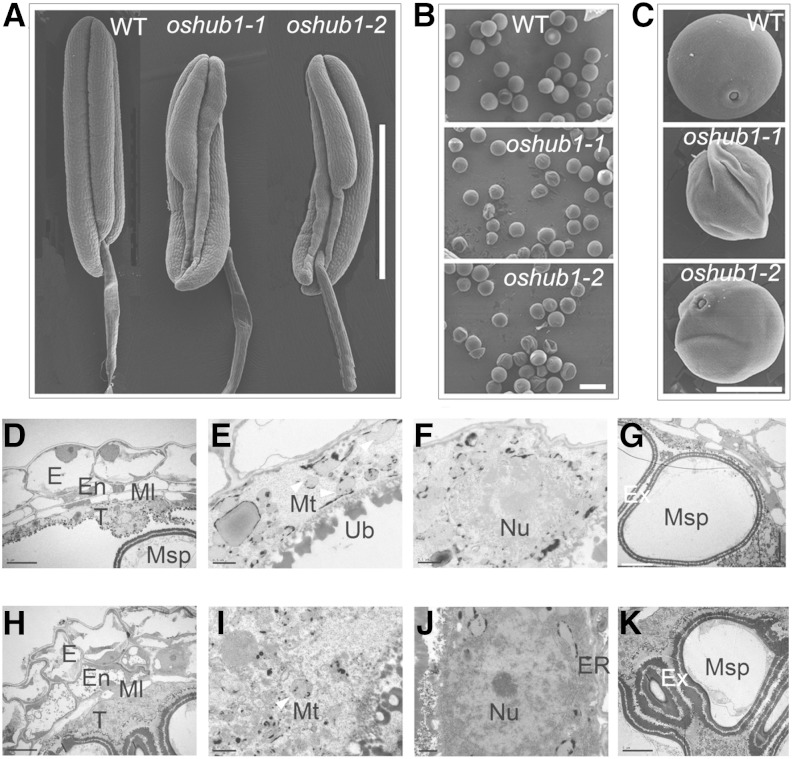
Figure 3.
Scanning electron microscopy and transmission electron microscopy of wild-type (WT) and oshub1 anthers. A and B, Comparison of anthers before anthesis (A) and mature pollen grains (B) derived from the wild type and oshub1 mutants. C, Higher magnification of pollen grains from wild-type and oshub1 mutant plants. D to G, The cross section of wild-type anthers at stage 10 showing anther wall layers (D), mitochondria (E) and nucleus (F) in tapetal layer, and microspore (G). H to K, The cross section of oshub1-1 anthers at stage 10 showing anther wall layers (H), mitochondria (I) and nucleus (J) in tapetal layer, and microspore (K). Mitochondria is marked by the white arrowhead in E and I. E, Epidermis; En, endothecium; ER, endoplasmic reticulum; Ex, exine; Ml, middle layer; Msp, microspore; Mt, mitochondria; Nu, nucleus; T, tapetum; Ub, ubisch body. Bars = 1 mm (A), 50 µm (B), 20 µm (C), 5 µm (D, H, G, and K), and 0.5 µm (E, F, I, and J).

