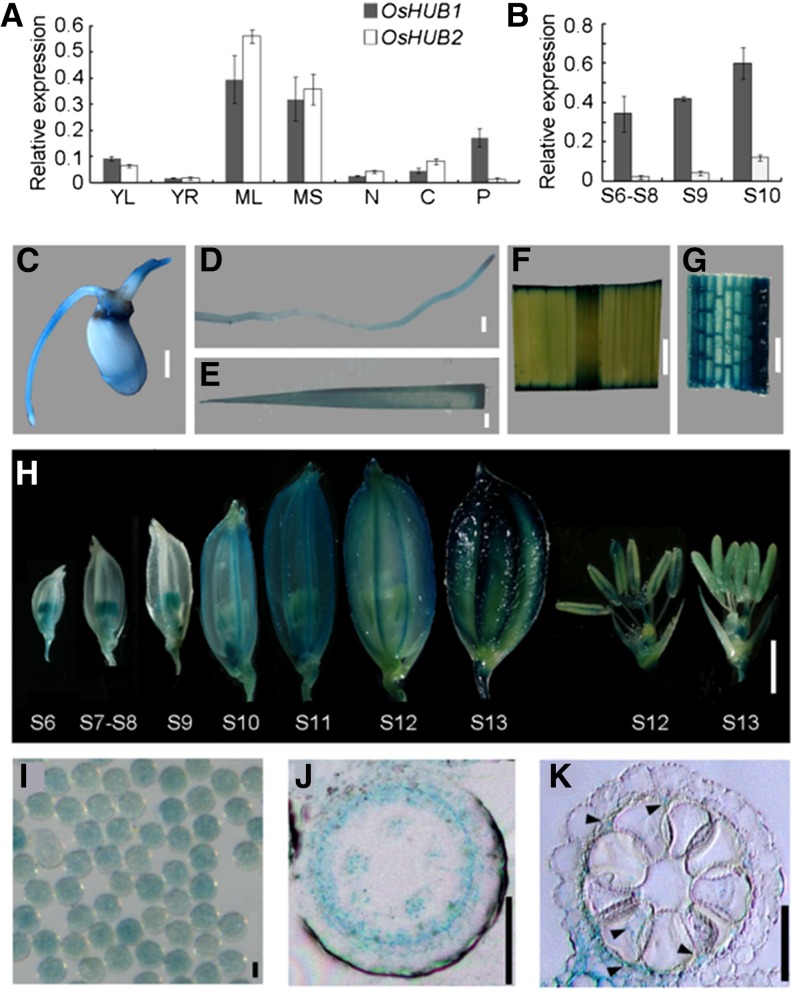
Figure 6.
Expression pattern of OsHUB1 and OsHUB2. A and B, qRT-PCR analysis of expression profiles for OsHUB1 and OsHUB2. S6 to S8 and S9 and S10 represent anther development at stages 6 to 8 and stages 9 and 10, respectively. ACTIN1 was used as internal control. Error bars indicate sd of three independent samples. YL, Young leaf; YR, young root; ML, mature leaf; MS, mature sheath; N, node; C, culm; P, panicle. C to H, Histochemical analysis of OsHUB1 expression in a germinating seed (C), young root (D), young leaf (E), mature leaf (F), leaf sheath (G), spikelet at various stages (H), and mature pollen grains (I) from transgenic plants expressing GUS driven by the OsHUB1 promoter. S6 to S13 refer to stages 6 to 13. J and K, GUS staining in a transverse section of a stage-8 (J) and a stage-10 (K) anther locule. Arrowheads in K show the GUS signal. Bars = 2 mm (C–H) and 20 µm (I–K).

