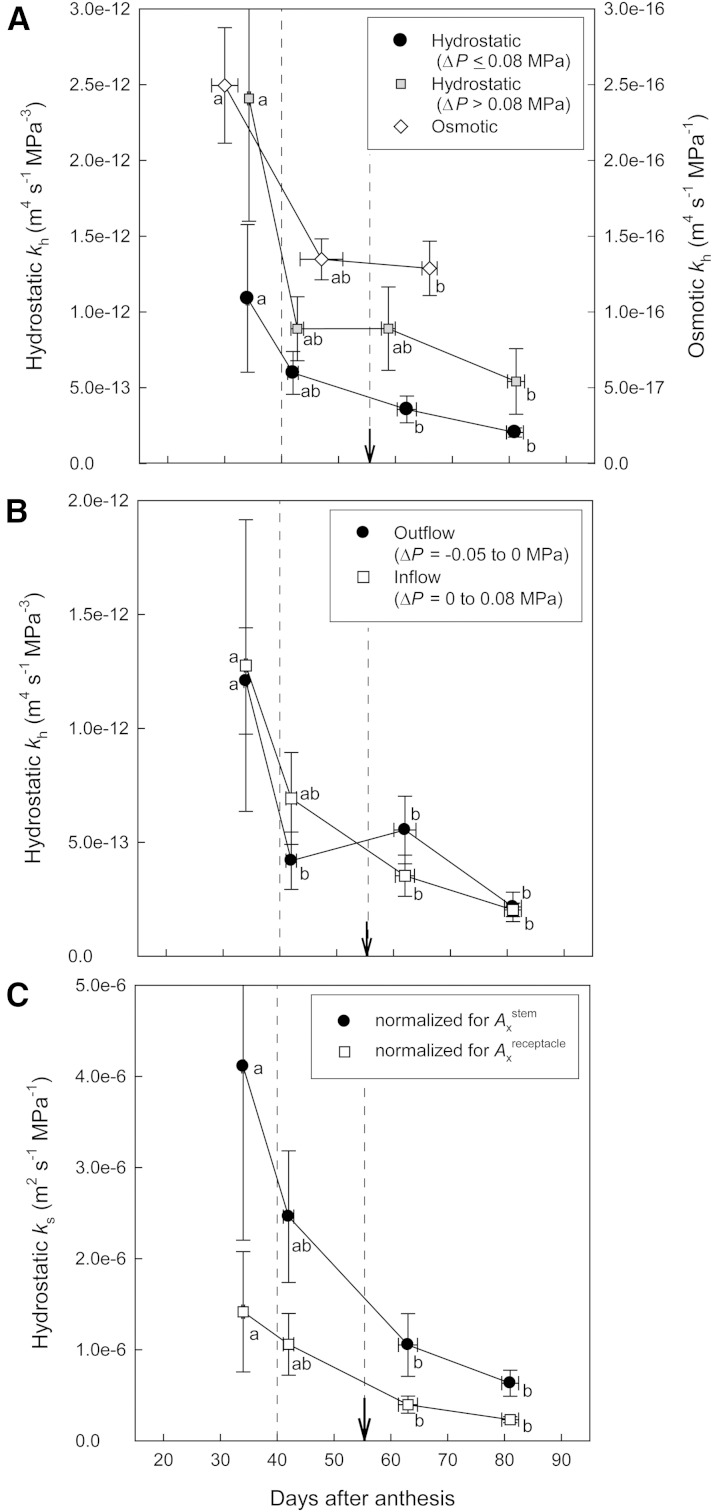
Figure 4.
Developmental changes in pedicel hydraulic properties as measured directly on excised pedicels using a modified pressure-probe system. A, Pedicel kh was determined for hydrostatically and osmotically induced water flows (note the difference in y scales). Based on the pressure-flow characteristics of the pedicel, hydrostatic kh was derived separately from low-ΔP (−0.05 to 0.08 MPa) and high-ΔP (greater than 0.08 MPa) steps. B, Pedicel hydrostatic kh as determined under water inflow and outflow conditions using low ΔP values. C, Specific hydraulic conductivity (ks) as determined by normalizing hydrostatic kh measured under low ΔP for Ax of either stem or receptacle portion. Data are means ± se. In A, n = 4, 5, 13, and 5 (black circles), n = 4, 4, 8, and 5 (gray squares), and n = 5, 3, and 9 (white diamonds); in B, n = 4, 5, 13, and 5 (white squares) and n = 3, 5, 6, 4 (black circles); in C, n = 4, 5, 13, and 5 for samples analyzed at less than 40 DAA (stage I), 40 to 55 DAA (stage II), 55 to 75 DAA (stage III), and 75 to 90 DAA (stage III), respectively. When se is smaller than the symbol size, it is not visible. For each parameter, different letters indicate significant differences (P < 0.05) between means (Tukey-Kramer test). The arrows indicate veraison. Dashed lines indicate the estimated boundaries between stages I and II and stages II and III in fruit expansion (Fig. 1A).

