Figure 2.
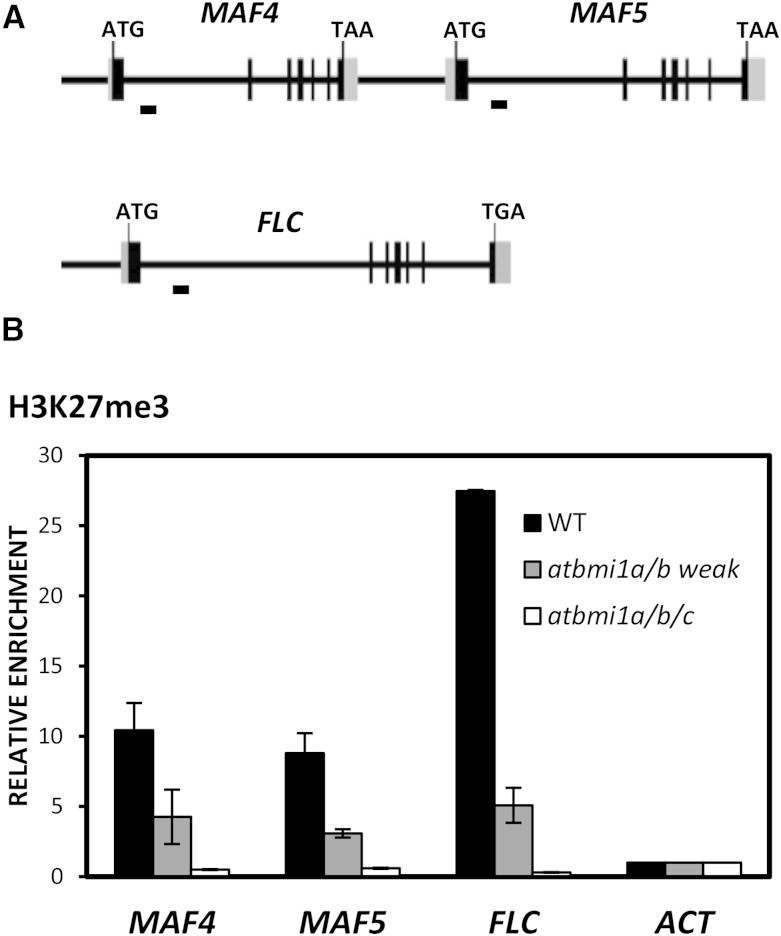
H3K27me3 levels at MAF4, MAF5, and FLC are altered in atbmi1 mutants. A, Schematic diagram of MAF4, MAF5, and FLC genomic regions. Exons and untranslated regions are represented by black and gray boxes, respectively, while introns and other genomic regions are represented by black lines. The translation start site (ATG) and stop codon (TAA or TAG) are indicated. DNA fragments amplified in chromatin immunoprecipitation (ChIP) assays are indicated below the genomic regions. B, ChIP analysis of H3K27me3 levels at the FLC, MAF4, and MAF5 first intron region in wild-type (WT), atbmi1a/b weak, and atbmi1a/b/c seedlings at 10 DAG. ACT7 was used as a negative control. The immunoprecipitated DNAs were quantified and normalized to ACT7. Error bars indicate the sd of two biological replicates.

