Figure 3.
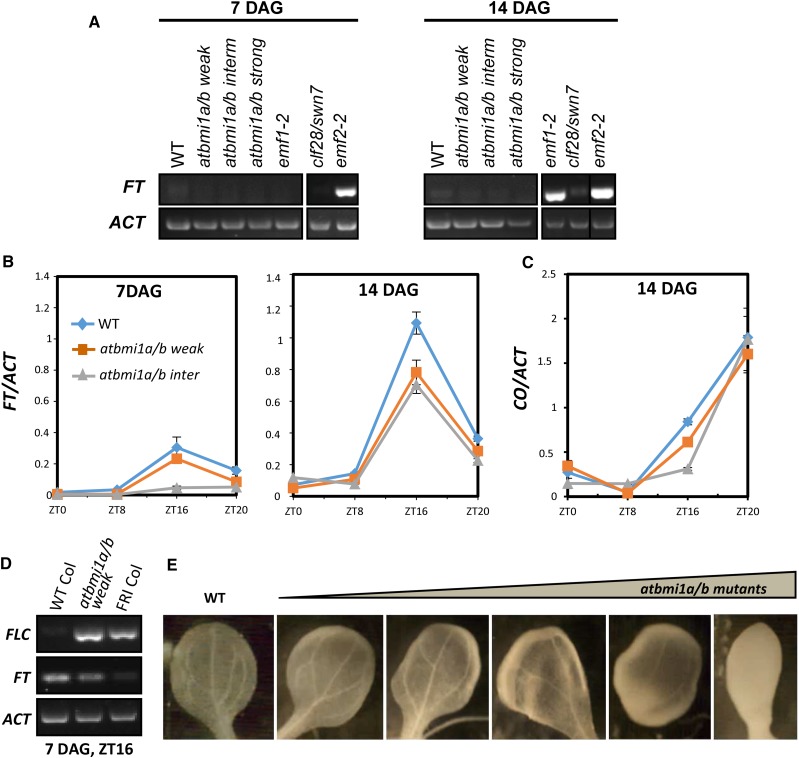
FT expression in atbmi1 mutants is CO dependent. A, Expression levels of FT in 7- and 14-d-old plants at ZT1 under LD conditions. ACT2 was used as an internal control (samples are as in Fig. 1H). B, FT mRNA levels in the indicated seedlings over an LD cycle at 7 and 14 DAG. C, CO mRNA levels over an LD cycle at 14 DAG. FT and CO transcript levels were normalized to ACT2; error bars indicate the sd of two biological repeats. D, FLC and FT transcript levels in 7-d-old wild-type (WT) Col, atbmi1a/b weak, and FRI-Col seedlings under LD conditions at Zeitgeber time 16 (ZT16). E, Vasculature organization of 10-d-old cotyledons from wild-type Col and different atbmi1a/b phenotypes.

