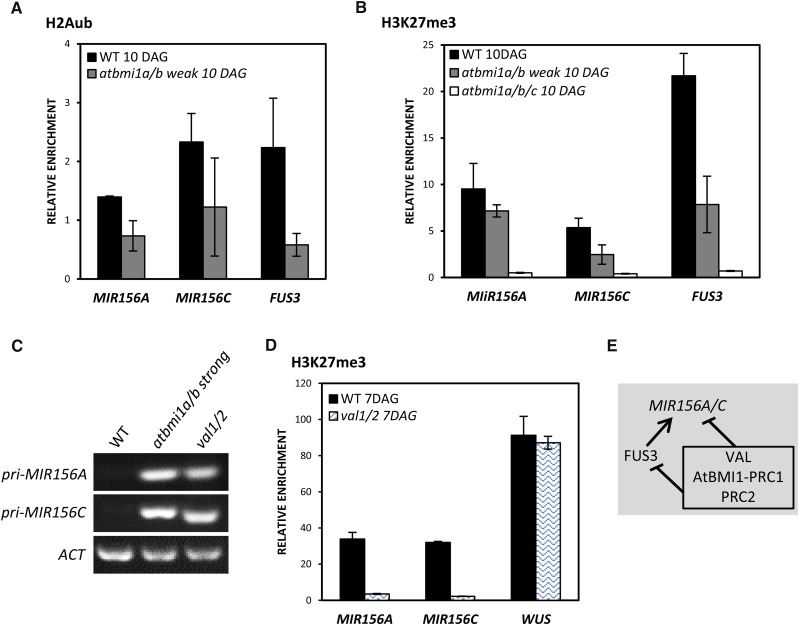
Figure 5.
MIR156A and MIR156C are direct targets of AtBMI1. A, ChIP analysis of H2Aub levels at MIR156A and MIR156C TSS in wild-type (WT) and atbmi1a/b weak seedlings at 10 DAG. FUS3 was used as a positive control. B, ChIP analysis of H3K27me3 levels at MIR156A and MIR156C TSS in wild-type, atbmi1a/b weak, and atbmi1a/b/c seedlings at 10 DAG. FUS3 was used as a positive control. The immunoprecipitated DNAs were quantified and normalized to ACT7. Error bars indicate the sd of at least two biological replicates. C, Expression levels of pri-MIR156A and pri-MIR156C in the wild type, atbmi1a/b strong, and val1/2 mutants at 10 DAG. ACT2 was used as an internal control. D, ChIP analysis of H3K27me3 levels at the TSS of MIR156A and MIR156C in wild-type and val1/2 seedlings at 7 DAG. WUSCHEL (WUS) was included as a negative target of VAL and a positive control of H3K27me3 (Yang et al., 2013a). The immunoprecipitated DNAs were quantified and normalized to ACT7. Error bars indicate the sd of two biological replicates. E, Schematic representation of MIR156A/C regulation by VAL-AtBMI1-PRC1/PRC2 and FUS3. Lines with bars indicate the repression of gene expression, and the line with the arrow indicates activation.

