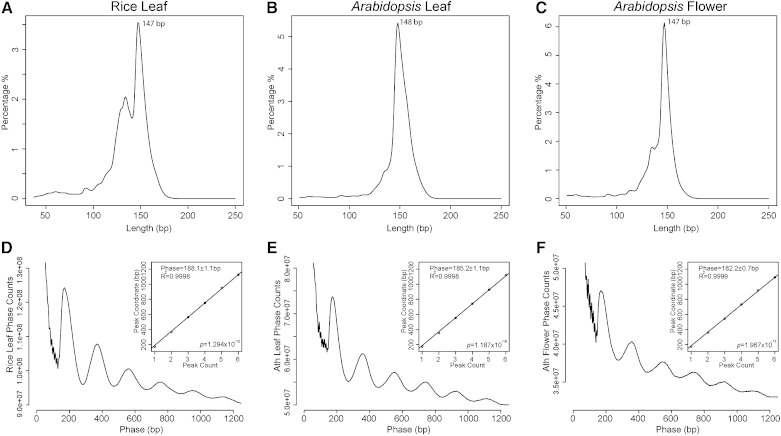
Figure 1.
Size and phasing of nucleosomes in Arabidopsis and rice. A to C, Distributions of lengths of MNase-digested mononucleosomal DNA fragments derived from RL (A), AL (B), and AF tissues (C). The x axes represent the lengths of the MNase-seq sequence reads, and the y axes represent the percentages for each length. D to F, Phasograms of nucleosomes. The x axes show the ranges of recorded phases, and the y axes represent the frequencies of distance between the midpoints of two fragments from RL (D), AL (E), and AF tissue (F). Insets in D to F, Linear fit to the positions of the phase peaks.

