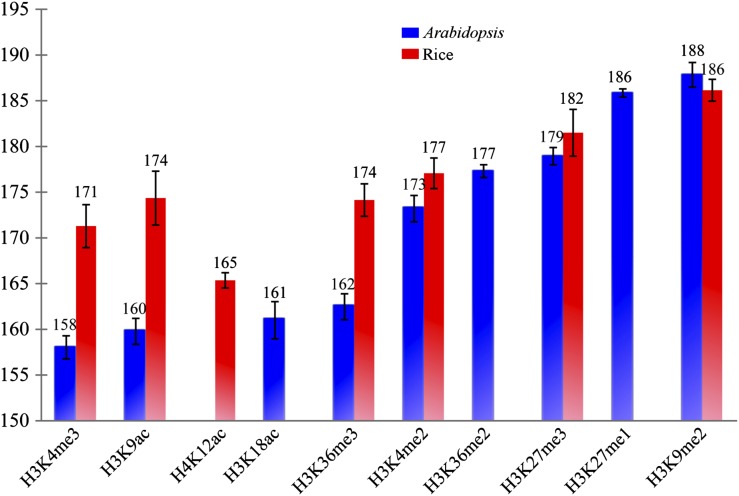
Figure 2.
Spacing of nucleosomes associated with specific histone modification markers. The x axis shows different histone modification markers. The y axis represents the average distance between two adjacent nucleosomes. All histone modification data were derived from leaf tissues in both species. H3K27me1, H3K27me3, and H3K9me2 are histone modification marks that are considered to be associated with heterochromatin. The rest of the histone modification marks are associated with euchromatin.

