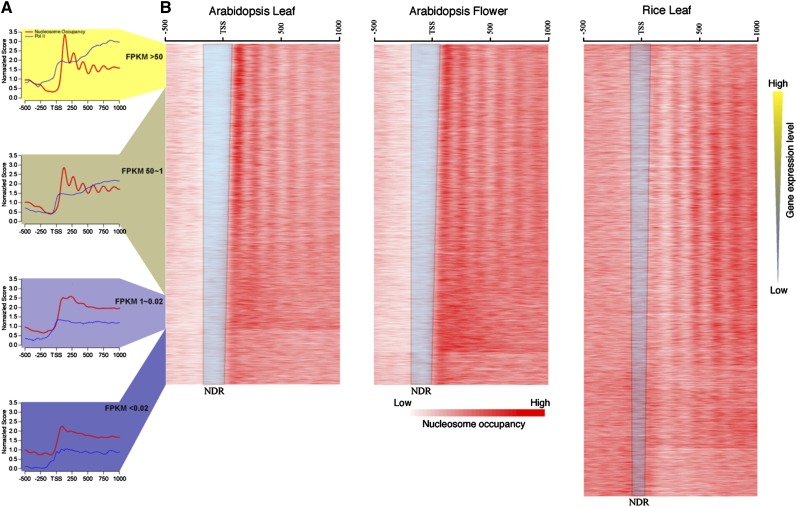
Figure 5.
Relationship between gene expression and nucleosome positioning. A, Profiles of nucleosome positioning and Pol II occupancy (Chodavarapu et al., 2010) grouped based on the expression levels of all Arabidopsis genes in leaf tissue. The red lines show the nucleosome occupancy, and the blue lines represent the Pol II occupancy. B, Heat maps of nucleosome occupancy associated with rice and Arabidopsis genes sorted based on levels of expression. The blue trapezoids include nucleosome-depleted regions (NDRs) of the genes. Note that RNA-seq data from rice and Arabidopsis were obtained from same tissues used for MNase-seq.

