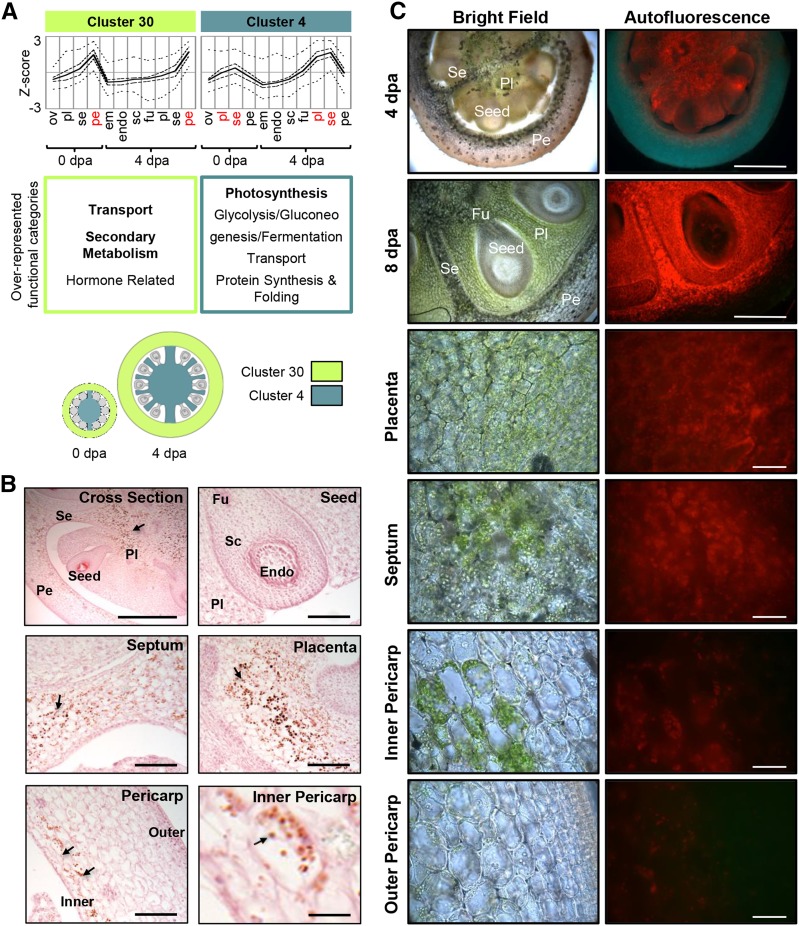
Figure 4.
Stage-independent gene clusters. A, Average profiles of cluster 30 and cluster 4. Cluster-wide average expression is plotted with solid lines, first and third quartiles by dashed lines, and maximum and minimum by dotted lines. Overrepresented functional category annotations are indicated below each cluster (P < 0.05, regular type; P < 0.01, boldface type). Clusters are represented graphically with coloring indicating the tissues where each is predominantly expressed. B, Starch accumulation in 4-DPA (dpa) fruit. Sections were stained with Lugol’s solution and counterstained with Safranin O (pink) to show anatomy. Starch granules (arrows, dark brown) are visible in the placenta, septum, and inner pericarp. Bars = 500 μm (cross section), 100 μm (seed, placenta, septum, and pericarp), and 20 μm (inner pericarp). C, Chlorophyll distribution in 4-DPA (top row) and 8-DPA (other rows) fruit. Chlorophyll is green in bright-field images and red in fluorescence images. Bars = 500 μm (top two rows) and 50 μm (other rows). Sample labels are as follows: em, embryo; endo, endosperm; fu, funiculus; ov, ovules; pe, pericarp; pl, placenta; sc, seed coat; and se, septum.

