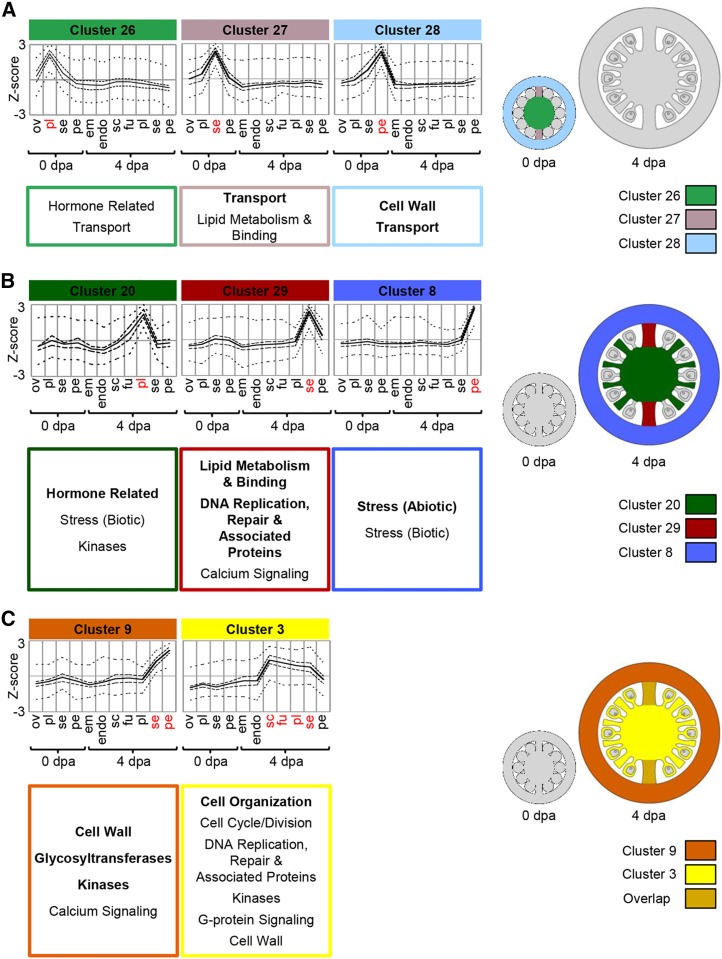
Figure 5.
Stage-dependent gene clusters. Average profiles of clusters are primarily expressed at a single developmental stage. Cluster-wide average expression is plotted with solid lines, first and third quartiles by dashed lines, and maximum and minimum by dotted lines. Overrepresented functional category annotations are indicated below each cluster (P < 0.05, regular type; P < 0.01, boldface type). Clusters are represented graphically with coloring indicating the tissues where each is predominantly expressed. Sample labels are as follows: em, embryo; endo, endosperm; fu, funiculus; ov, ovules; pe, pericarp; pl, placenta; sc, seed coat; se, septum; and dpa, DPA.

