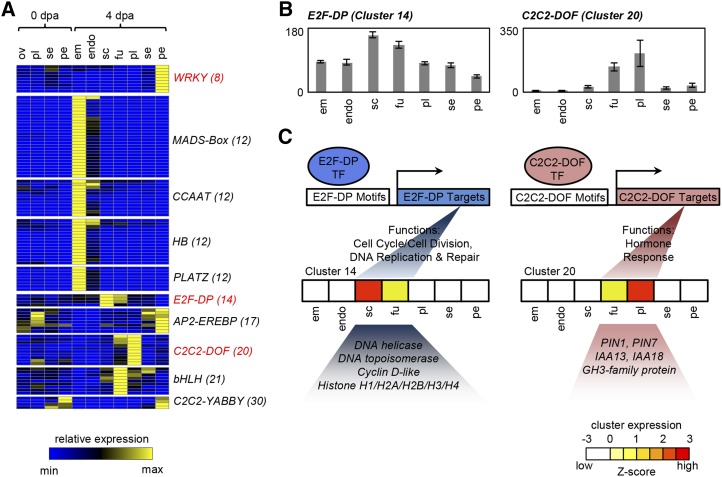
Figure 8.
Transcription factor profiling and examples of hypothetical regulatory modules. A, Heat map showing the expression of transcription factor families that are overrepresented among coexpression clusters. Cluster numbers are given in parentheses. B, Cumulative expression of E2F-DP (eight members) and C2C2-DOF (10 members) transcription factors in 4-DPA fruit. C, Hypothetical models of E2F- and C2C2-DOF-mediated transcriptional regulation of genes in cluster 14 (internal tissues) and cluster 20 (placenta). The expression of each cluster is represented by a heat map showing overlap with the respective transcription factor expression. Functional categories associated with each transcription factor are overrepresented in these clusters. E2F and C2C2-DOF proteins are suggested to interact with E2F- and C2C2-DOF-binding motifs, respectively, which are enriched in the promoters of genes in cluster 14 or cluster 20 (Supplemental Table S8). Sample labels are as follows: em, embryo; endo, endosperm; fu, funiculus; ov, ovules; pe, pericarp; pl, placenta; sc, seed coat; se, septum; and dpa, DPA.

