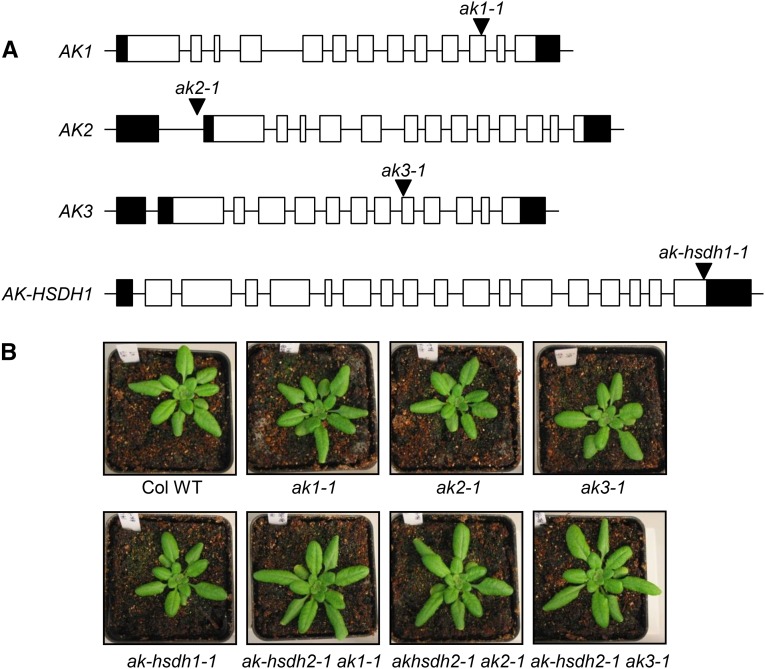
Figure 3.
T-DNA locations and plant images of other single or double ak and ak-hsdh mutants. A, Schematic representation of the AK1, AK2, AK3, and AK-HSDH1 genes and four T-DNA insertion alleles. Black rectangles represent 5′- and 3′-untranslated regions, white rectangles represent exons, black lines represent introns and intergenic regions, and black triangles represent T-DNA insertions. ak1-1, WiscDsLox461-464J6; ak2-1, SALK_003685; ak3-1, SALK_043533; ak-hsdh1-1, SALK_125957. B, Images of 4-week-old Col-0 wild-type (Col WT) and single- or double-mutant plants under a 12-h-light/12-h-dark photoperiod.

