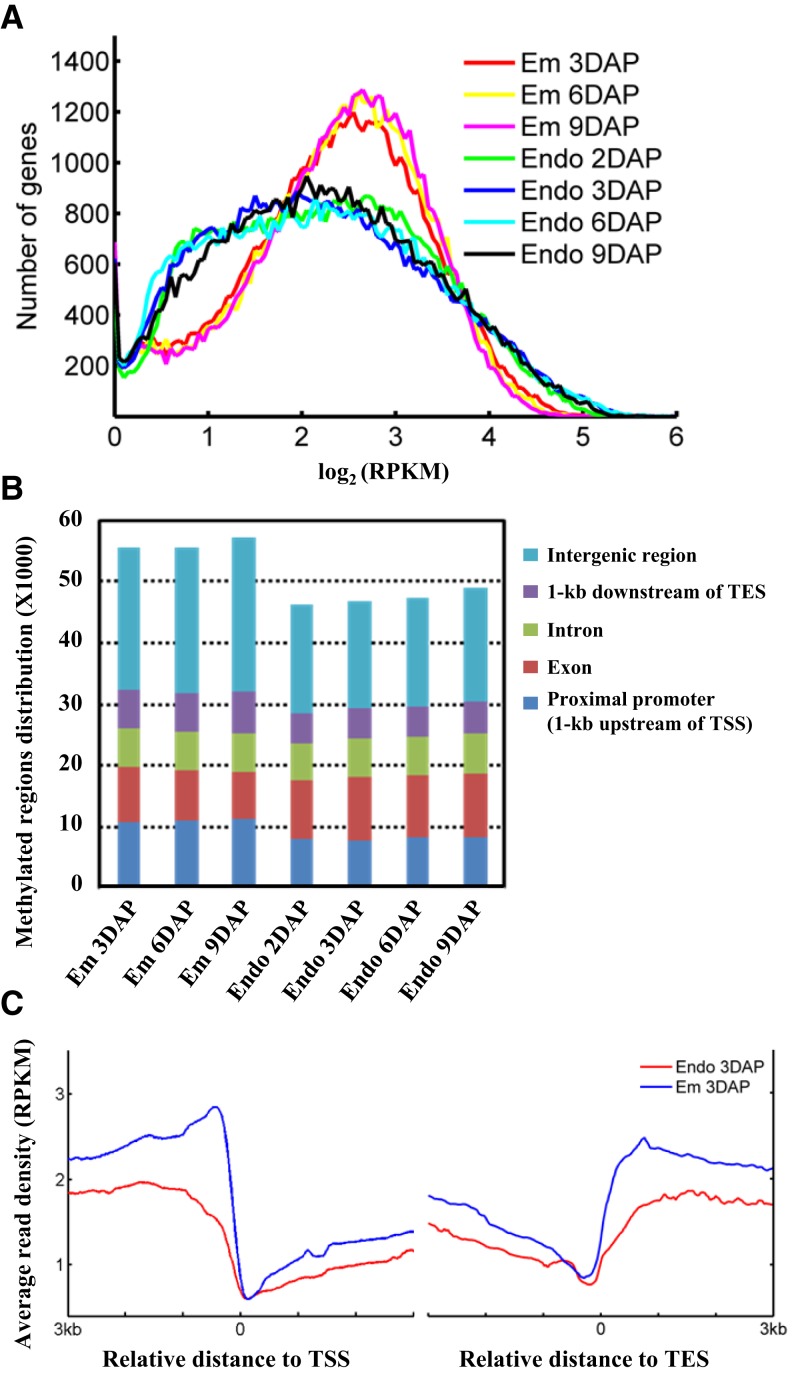
Figure 1.
Global patterns of DNA methylation during rice seed development. A, Distribution of gene methylation density during rice endosperm and embryo development. The x axis represents the gene methylation level defined based on read density normalized by sequencing depth and gene length (reads per kilobase per million mapped reads [RPKM]) from 3 kb upstream of the transcriptional start site (TSS) to 3 kb downstream of the transcriptional end site (TES). Similar results were obtained for both promoter regions (Supplemental Fig. S2A) and the transcriptional termination region (1 kb downstream of the TES; Supplemental Fig. S2B). The Kolmogorov-Smirnov (K-S) test was performed and revealed a significant difference (P < 0.001) between embryo and endosperm across all developmental stages. B, Distribution of the methylated regions in relation to gene annotation. Genomic regions were divided into five categories: proximal promoter (1 kb upstream of the TSS), exon, intron, transcriptional termination region (1 kb downstream of the TES), and intergenic region. Student’s t test was performed and revealed a significant difference in the intergenic region between embryo and endosperm (P = 0.00156). C, Methylation profiles around the TSS and TES of non-TE genes for endosperm and embryo. The x axis represents the relative distance to the TSS (left) or the TES (right), and the y axis represents the average read density normalized by sequencing depth and window size of 20 bp (RPKM). Student’s t test was performed and revealed a significant difference in the methylation level around the TSS and TES between embryo and endosperm at 3 DAP (P < 0.001). The methylation pattern at 3 DAP is shown, and the other samples have the same pattern.

