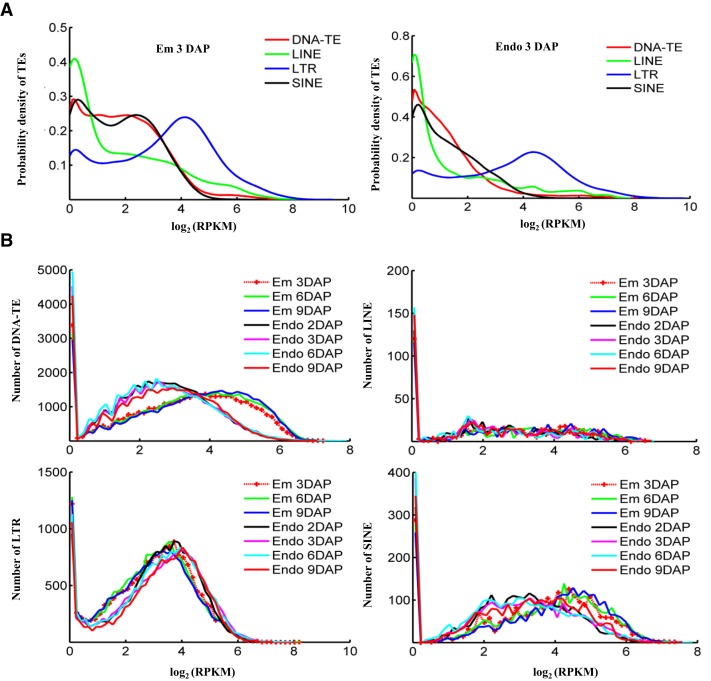
Figure 2.
Methylation patterns of TEs. A, Distribution of the methylation read density for DNA-TEs, LINEs, LTRs, and SINEs in embryo and endosperm. The methylation level of TE was defined based on average read density normalized by sequencing depth (RPKM). The read density distribution of embryo or endosperm at 3 DAP is shown, and the other samples have the same pattern. The K-S test was performed and revealed a significant difference between LTR and other TEs (P < 0.001). B, Read density distribution of TEs in all samples, with one plot for one type of TE. The K-S test was performed and revealed a significant difference in the numbers of DNA-TEs and SINEs between embryo and endosperm (P < 0.001).

