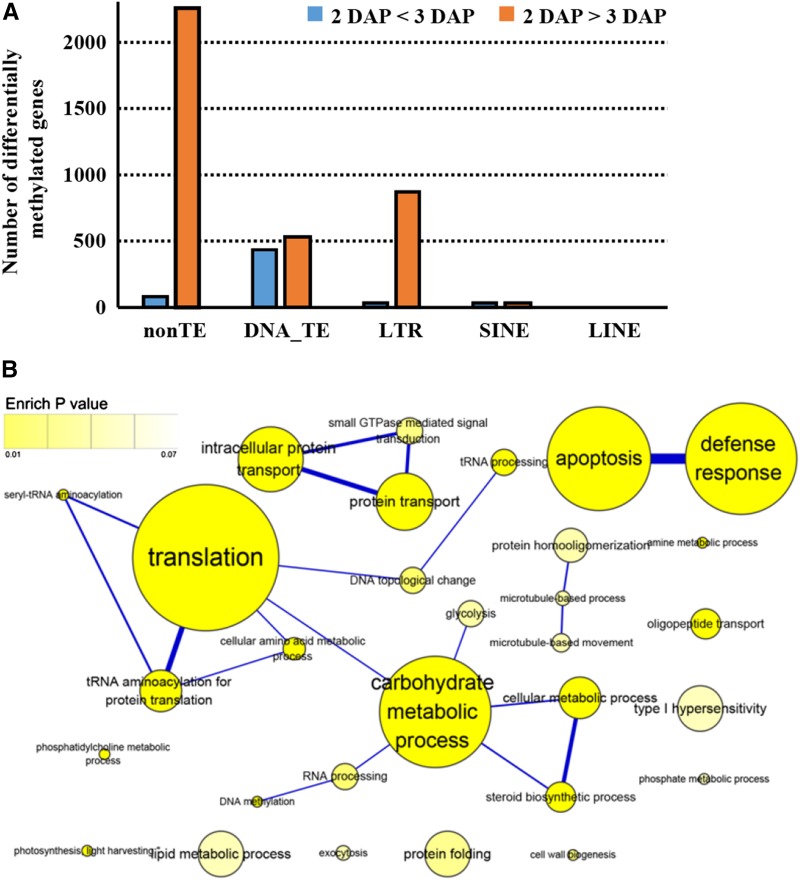
Figure 5.
DNA methylation status during early endosperm development. A, Numbers of differentially methylated elements at 2 and 3 DAP during early endosperm development. B, GO term enrichment network of highly methylated (log2 [ChIP-seq intensity ratio; M] M > 1 and P < 1e-5) genes at 2 DAP compared with 3 DAP in endosperm. Nodes represent enriched GO terms, and the color intensity is proportional to the significance of enrichment. The area of a node is proportional to the number of genes in the test set belonging to that GO category. The weight of the edges represents the number of genes shared by a pair of GO terms.

