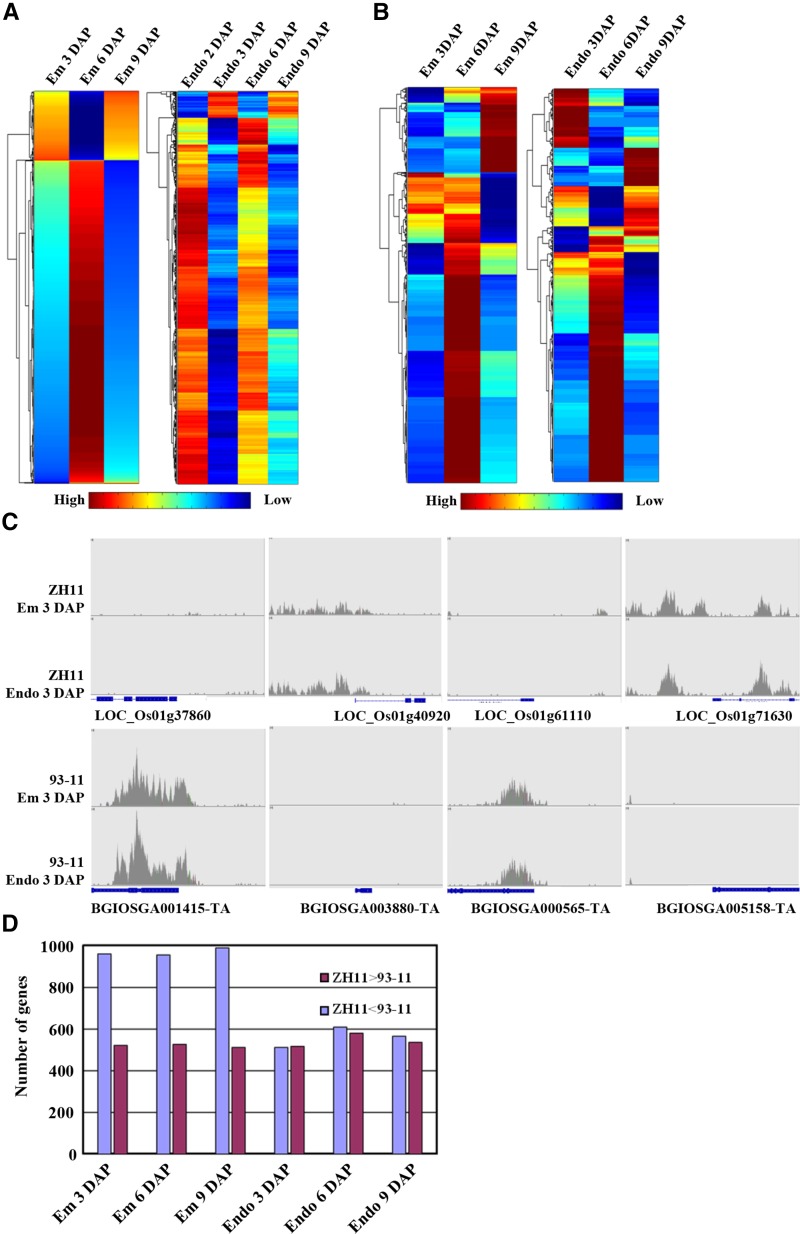
Figure 6.
Methylation patterns of embryo and endosperm in ZH11 and 93-11. A and B, Heat map of read intensity for differentially methylated regions during endosperm and embryo development in ZH11 (A) and 93-11 (B). Each column represents a time point during embryo or endosperm development, and each row represents a differentially methylated region between all neighboring stages during embryo or endosperm development. The color scale in red (high), yellow (medium), and blue (low) represents the relative methylation level. C, Representative genes showing differential methylation between ZH11 and 93-11. D, Number of genes exhibiting differential DNA methylation between ZH11 and 93-11 at different developmental stages. The number of reads from 1 kb upstream of the TSS to 1 kb downstream of the TES was used for analysis.

