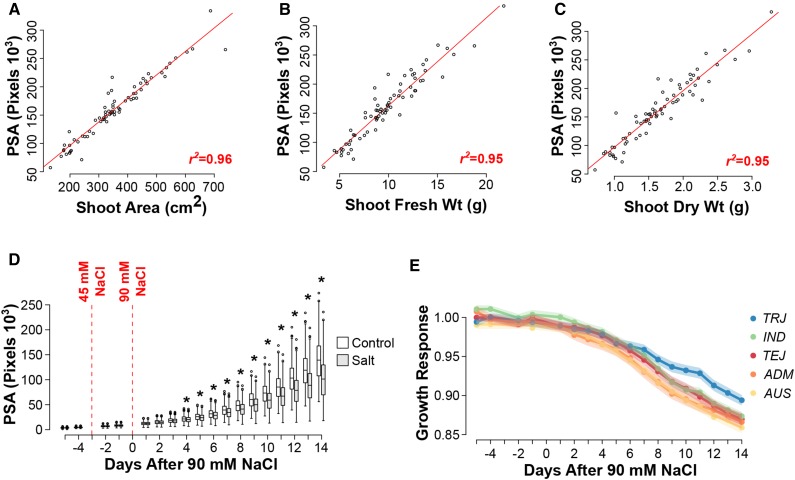
Figure 1.
Salinity-induced growth responses in a rice diversity panel. A to C, Relationship between PSA and conventional biomass metrics. Pearson correlation analyses were performed between PSA and shoot area (A), shoot fresh mass (B), and shoot dry mass (C). D, Comparisons of PSA between treatments at each of the 18 d of imaging. Differences between treatments at each time point were determined using a one-way blocked ANOVA, where accession is considered as a block (P < 0.0027). E, Comparison of salinity-induced growth response models between each of the five subpopulations defined by Zhao et al. (2011). The salinity-induced growth response was modeled with a decreasing logistic curve, and pairwise comparisons were made between each subpopulation. Aromatic accessions were excluded due to low n. Mean growth responses for each subpopulation are denoted by solid lines, while the se for each subpopulation is indicated by shadows. TRJ, Tropical japonica; TEJ, temperate japonica; IND, indica; ADM, admix.

