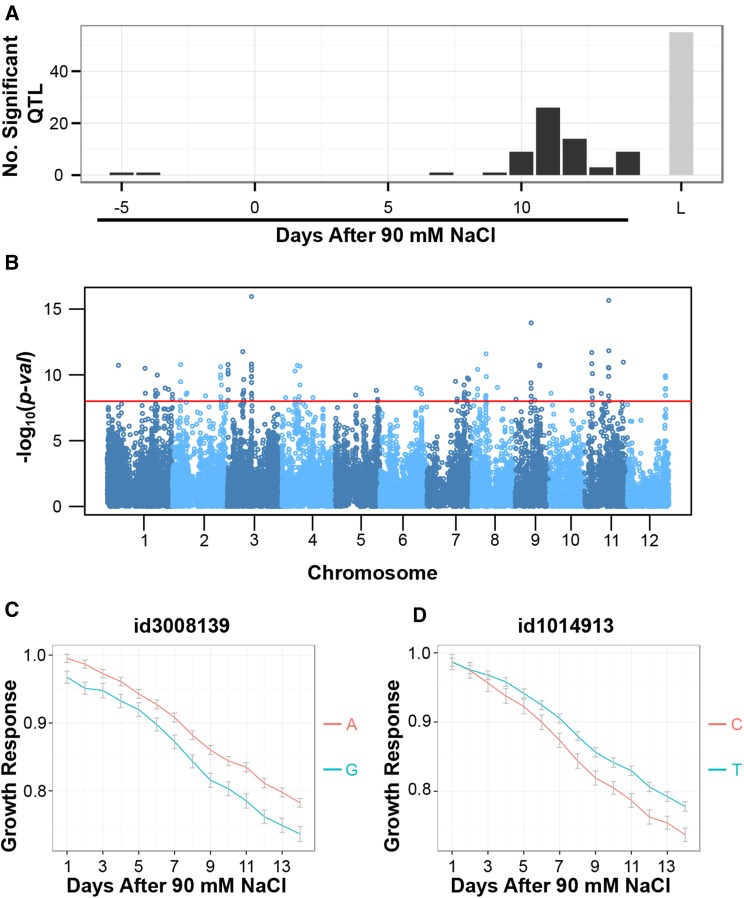
Figure 3.
Examining the genetic architecture of salinity-induced growth responses using conventional mixed-model and logistic growth response association analysis. A, Comparison of conventional mixed-model association mapping approach with logistic growth response association mapping approach. A conventional association mapping approach was performed at each time point using the salinity-induced growth response as a phenotypic measure. With the mixed-model approach, an SNP was determined to be significant if P < 10–4, while a threshold of P < 10–8 was used for the logistic growth response model. Significant SNPs within a 200-kb window were combined and considered as a single QTL. L, Logistic growth response model. B, Manhattan plot for the logistic growth response association analysis. The red horizontal line indicates a significance threshold of P < 10–8. C, Comparison of growth response trajectories between allelic groups for the significant association observed at approximately 16.3 Mb on chromosome 3. A indicates the major allele (frequency, 0.68), and G indicates the minor allele (frequency, 0.32). D, Growth trajectories of major and minor allele accessions for the signal observed at approximately 25 Mb on chromosome 1. T indicates the major allele (frequency, 0.79), and C indicates the minor allele (frequency, 0.21).

