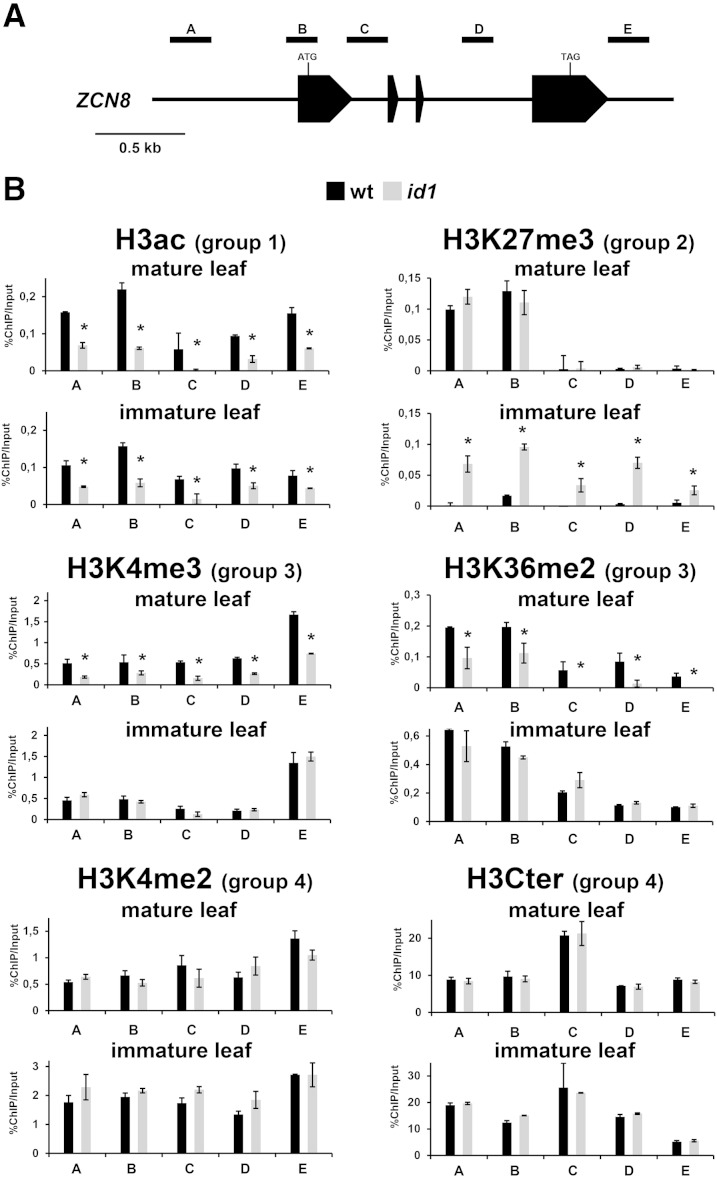
Figure 4.
Analysis of ZCN8 histone modifications in line B73 wild-type (wt) and id1 mutant plants. A, Schematic depiction of the ZCN8 gene, with black boxes representing exons. The positions of the regions analyzed in ChIP assays are indicated. B, Bar diagrams represent real-time PCR quantification of ChIP DNA, reported as percentage of the chromatin input, from assays performed using the indicated antibodies. The data are average values from two independent ChIP assays and from three PCR repetitions for each ChIP assay and are reported by subtracting the background signal, measured by omitting antibody during the ChIP procedure. Asterisks indicate statistically significant changes (P ≤ 0.01) in the id1 mutant versus the wild type. The grouping of histone marks on the basis of how its variation associates with the activity of the id1 gene is indicated in parentheses. Similar results were obtained after correction for nucleosome occupancy measured as reported by Rossi et al. (2007). H3Cter, Histone H3 C-terminal region.

