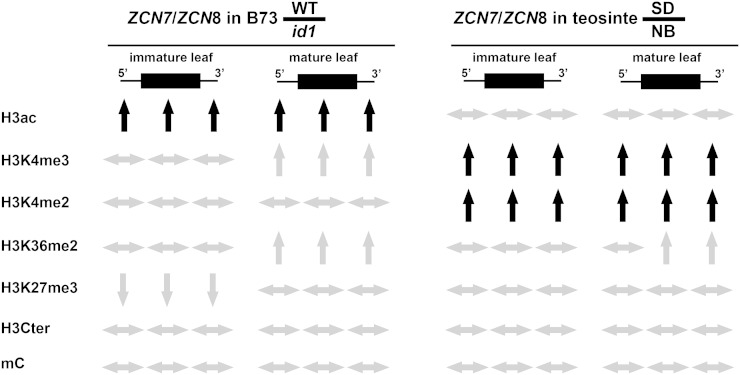
Figure 6.
Summary of ZCN7 and ZCN8 epigenetic pattern variations in line B73 and teosinte plants. The diagram is based on data reported in Figures 4 and 5 and in Supplemental Figures S6 and S7. The direction of each arrow indicates the direction of the change for the histone modification listed at left and for cytosine methylation (mC) measured by means of restriction with the MspJI enzyme. Variations of epigenetic mark levels that occur in immature leaf and that are maintained in mature leaf are highlighted by black arrows. WT, Wild-type.

