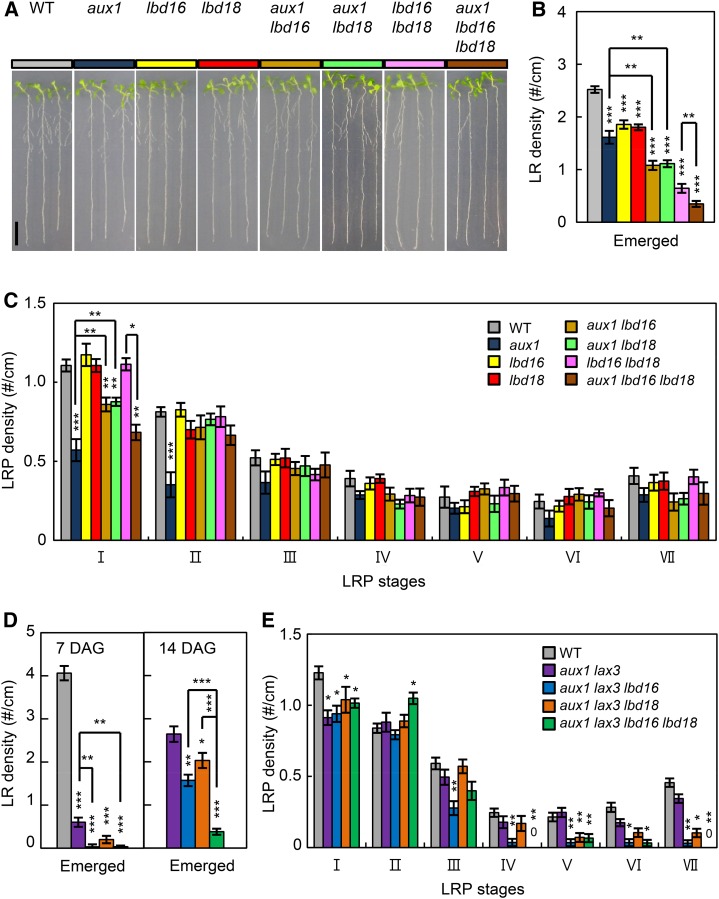
Figure 5.
Genetic analysis of aux1, lax3, lbd16, and lbd18 in LR development. A, LR phenotypes of 7-d-old seedlings of the wild type (WT; Col-0, gray), aux1 (ocean blue), lbd16 (yellow), lbd18 (red), aux1 lbd16 (orange), aux1 lbd18 (pastel green), lbd16 lbd18 (lilac), and aux1 lbd16 lbd18 (indigo blue) are shown. B, Density of emerged LRs (LR no. per unit primary root length; #/cm). Error bars = se. n = 20. Asterisks denote statistical significance (**, P < 0.01; and ***, P < 0.001). C, Density of primordia at given stages. Stages I to VII of primordia were based on the classification by Malamy and Benfey (1997). Error bars = se. n = 10. Asterisks denote statistical significance (*, P < 0.05; **, P < 0.01; and ***, P < 0.001). D, LR densities (LR no. per unit primary root length; #/cm) of 7- or 14-d-old seedlings of the wild type, aux1 lax3, aux1 lax3 lbd16, aux1 lax3 lbd18, and aux1 lax3 lbd16 lbd18. Error bars = se. n = 20. Asterisks denote statistical significance (**, P < 0.01; and ***, P < 0.001). DAG, Days after germination. E, Density of primordia at given stages of 7-d-old seedlings of the wild type, aux1 lax3, aux1 lax3 lbd16, aux1 lax3 lbd18, and aux1 lax3 lbd16 lbd18. Error bars = se. n = 10. Asterisks denote statistical significance (*, P < 0.05; **, P < 0.01; and ***, P < 0.001).

