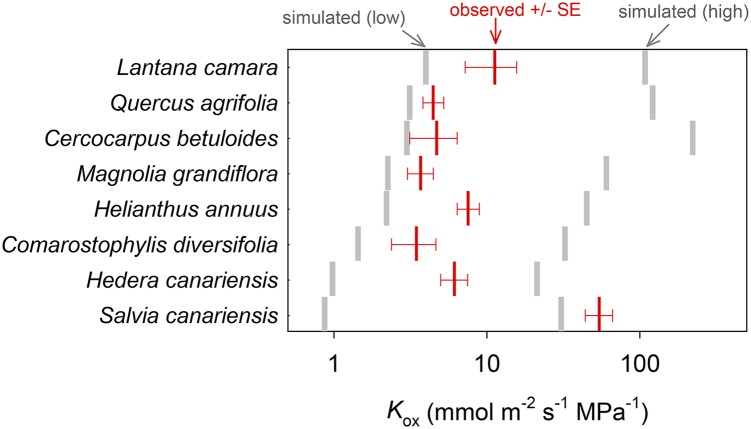
Figure 1.
Comparison of observed Kox (red bars; means ± se) with ranges of simulated Kox values possible for wide variation in unknown parameters [simulated (low) to simulated (high); gray bars]. For three of the unknown parameters (Poiseuille radius of apoplastic bulk flow pathways [Ra], osmotic water permeability of cell membranes [Pm], and the ratio of cell wall thickness used in the simulation to values measured by light microscopy [ρta]), the high and low Kox simulations used default values plus or minus 50%, respectively. For the other three unknown parameters (BS Casparian strip, horizontal palisade contact fraction ratio of true palisade horizontal connectivity to the value from microscopy [ρfcph], and vertical temperature gradient [ΔT]), we used the upper or lower limits of possible values (0% or 100% of apoplastic transport was blocked by a Casparian strip; ρfcph = 0 or 1; and ΔT = 0 or 0.2°C). Default values for these parameters are given in Table III.

