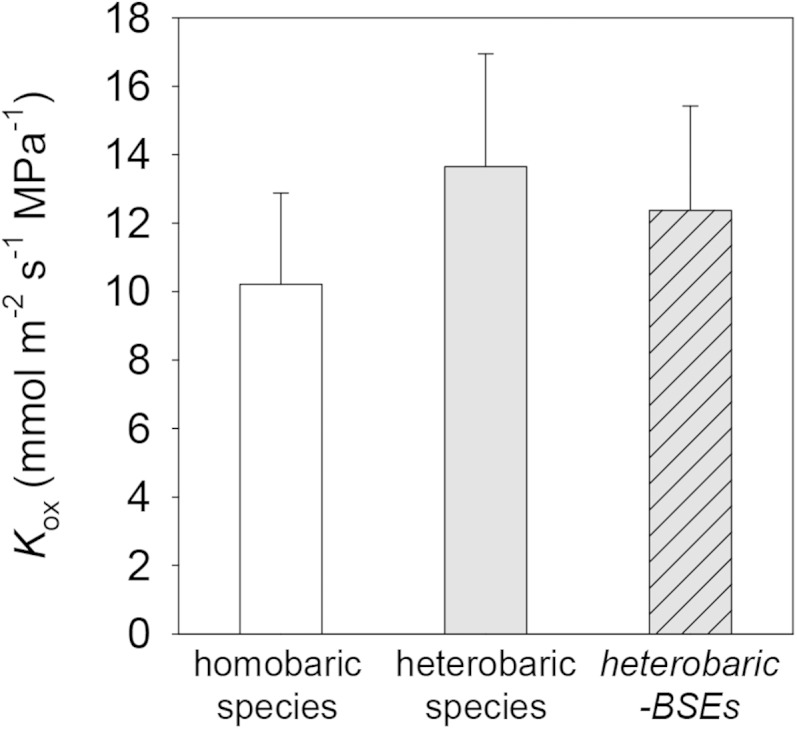
Figure 12.

Differences in Kox computed by the model for homobaric (white bar) and heterobaric (gray bars) species. For heterobaric species, an additional simulation was performed in which nodes in the grid corresponding to BSEs were assigned conductivities corresponding to the adjacent mesophyll (gray bar with hash marks).
