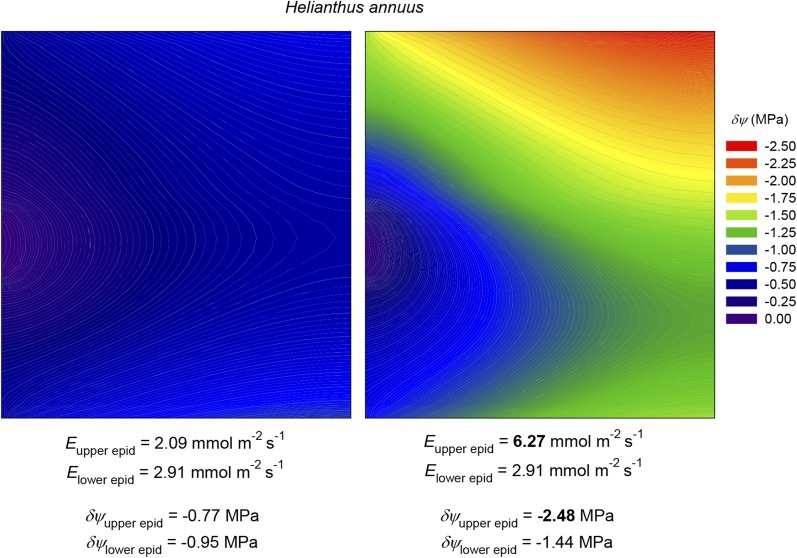
Figure 13.
Simulation of the effect of increasing transpiration rate (E) 3-fold at the upper surface of an amphistomatous leaf (H. annuus) while holding it constant at the lower surface. Color contours represent δψ; the areole margin (minor vein) is at left, and the areole center is at right; the upper and lower surfaces are at top and bottom, respectively. Left, before the change in transpiration rate; right, after the change. Initial and final transpiration rates for both surfaces, and δψ values for the epidermal nodes at the center of the areole at both surfaces, are shown at bottom. These simulations used default values for all parameters as given in Tables III and IV.

