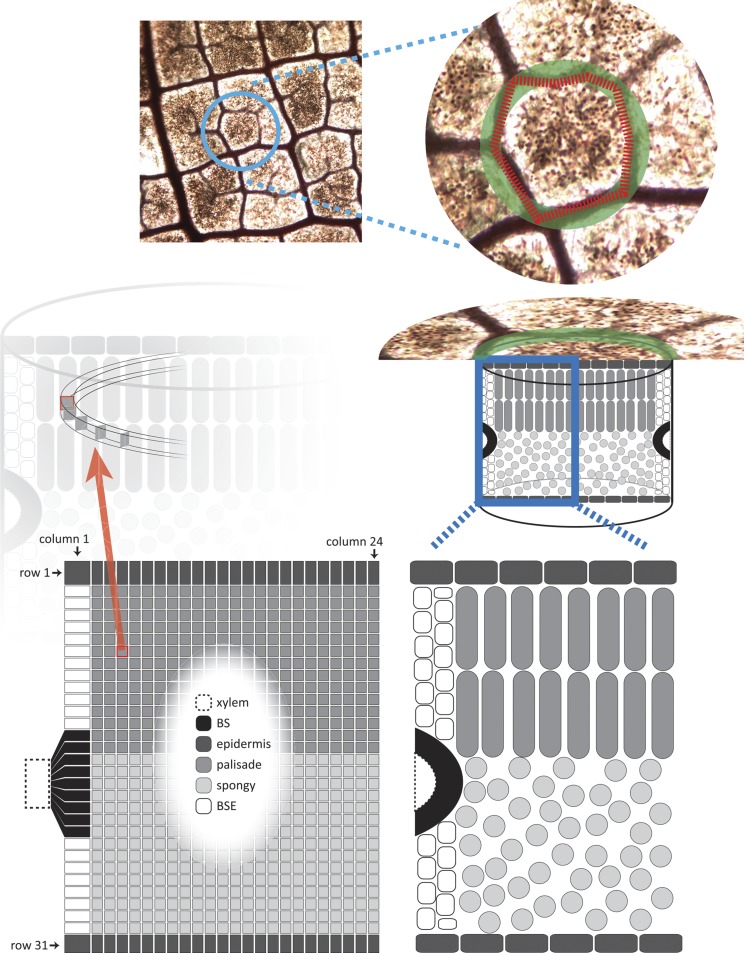
Figure 14.
Diagram of MOFLO structure. The model represents an areole (the smallest region of a leaf bounded by minor veins) as a circular and radially symmetrical region (top and middle right). Flow is simulated through a grid with 744 nodes (24 columns and 31 rows; bottom left) representing a transverse section through the areole; the left-hand edge of this grid corresponds to the outer margin of the areole, and the right-hand edge corresponds to the center of the areole. Grid nodes are allocated to tissue types based on measured tissue dimensions (compare with the grid at bottom left and the diagram of tissue types at bottom right).

