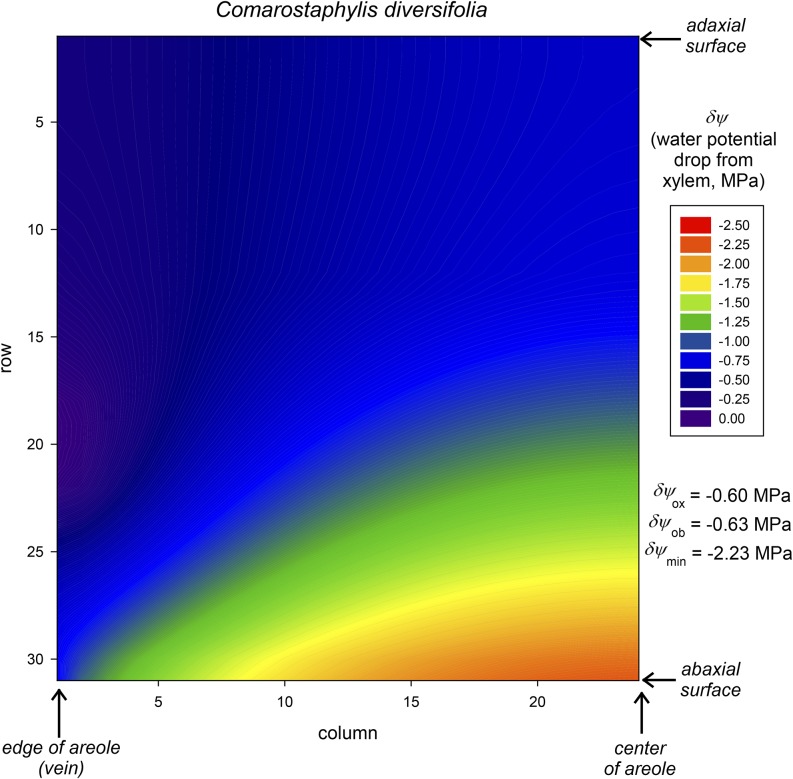
Figure 2.
Example of the distribution of water potential drawdown relative to the xylem (δψ) in a transverse leaf section as computed by MOFLO (for C. diversifolia in this example). Water potential is greatest in the BS (bottom left edge) and most negative in the lower epidermis near the areole center (bottom right). A large region of palisade mesophyll (top center) remains at quite high water potential because most water flow; thus, most potential drawdown occurs through the spongy mesophyll (bottom center). The volume-weighted average water potential drawdown (δψox) in this example is −0.6 MPa, or −0.63 MPa excluding the BS itself (δψob), but the largest drawdown (δψmin) is −2.23 MPa, and the volume-weighted mean drawdown to the lower epidermis is −1.02 MPa.

