Figure 8.
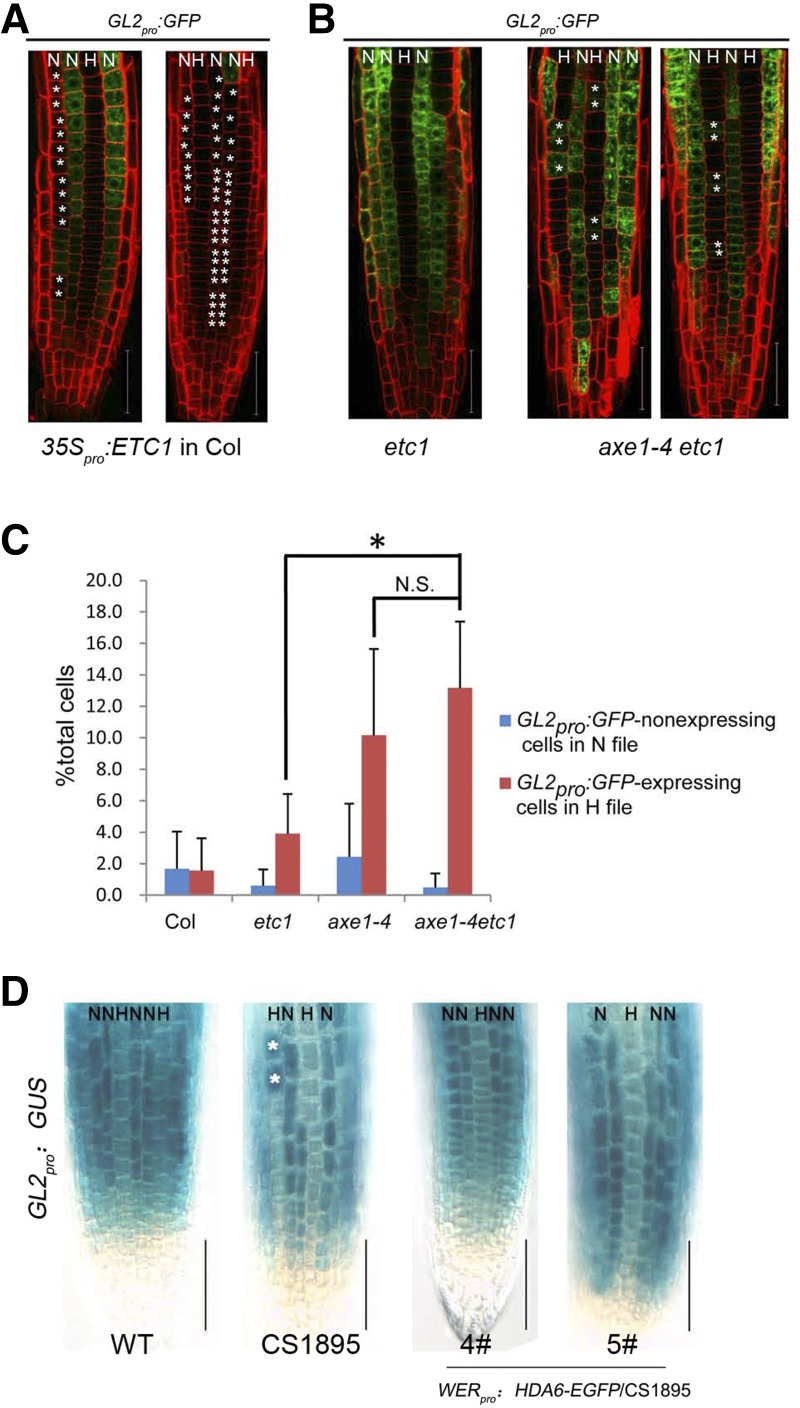
Analysis of HDA6’s effects on GL2. A, CLSM images of root tip of ETC1 overexpression lines bearing the GL2pro:GFP reporter gene. The asterisks indicate ectopic GL2pro:GFP-nonexpressing cells in the N position. Bars = 50 μm. B, CLSM images of root tip of the hda6/etc1 double mutant bearing the GL2pro:GFP reporter gene. The asterisks indicate ectopic GL2pro:GFP-expressing cells in the H positon. Bars = 50 μm. C, Quantification of the epidermal cell type pattern, showing percentages of ectopic GL2pro:GFP-nonexpressing cells in the N position (blue bars) and ectopic GL2pro:GFP-expressing cells in the H positon (red bars) for each line. *, P < 0.05, Student’s t test; N.S., no significance. D, Seven-day-old seedlings bearing the GL2pro:GUS reporter gene were stained for GUS activity. WT, Wild type. Bars = 50 μm.

