Figure 2.
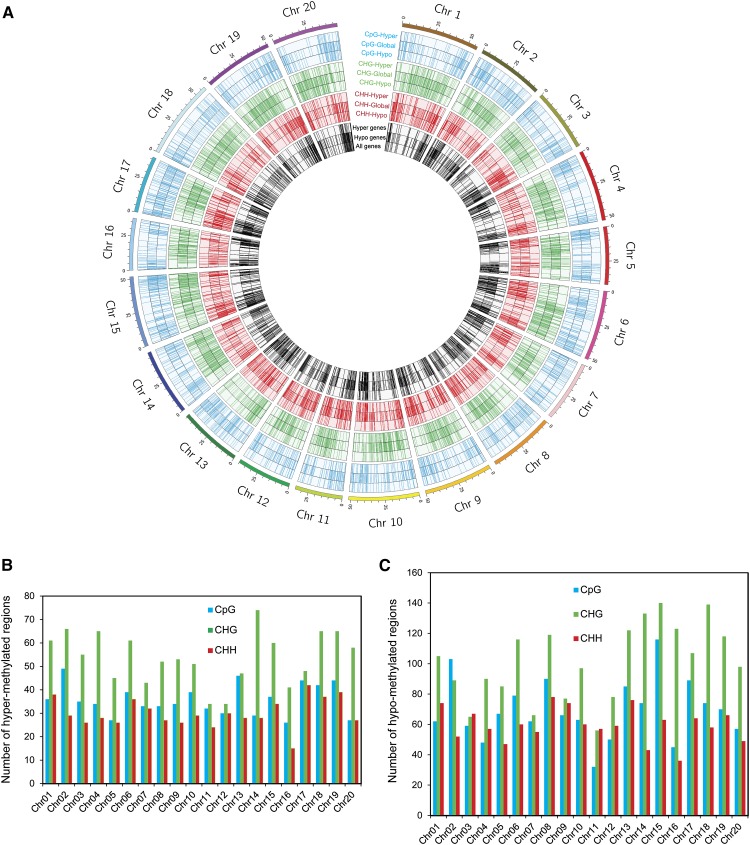
Genomewide mapping of differentially methylated regions and associated genes. A, A circle diagram showing chromosomal locations of the differentially hyper- and hypomethylated regions in CpG, CHG, and CHH contexts and overlapping genes into the 20 soybean chromosomes (Chr 1–Chr 20). B and C, Distribution of the differentially hypermethylated regions (B) and hypomethylated regions (C) in the 20 soybean chromosomes.

