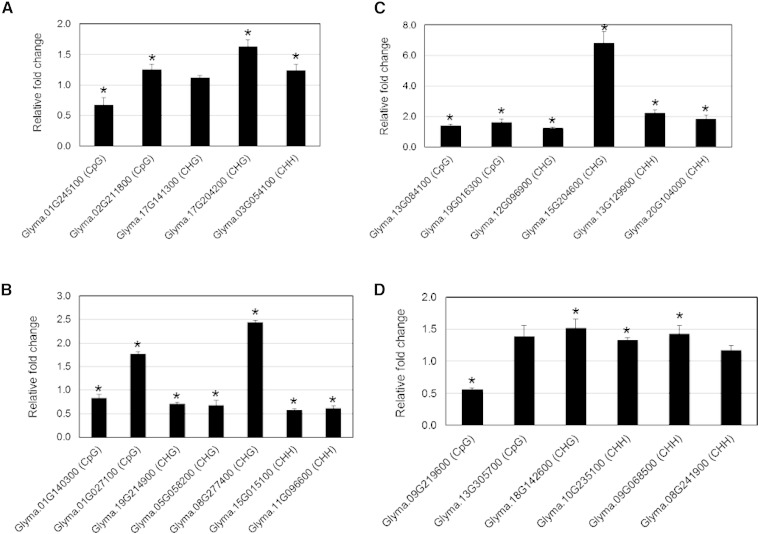
Figure 4.
qPCR quantification of the impact of DNA methylation in gene body and promoter regions on gene expression levels. A and B, Hypermethylation in gene body (A) or promoter regions (B) in various sequence contexts showed heterogeneous effects on gene expression levels. C and D, Hypomethylation in gene body (C) or promoter regions (D) in various sequence contexts was mainly associated with increased gene expression levels. The relative fold-change values were calculated using the 2−ΔΔCT method and represent changes of the expression levels in SCN-infected root tissues relative to noninfected controls. Data are averages of three biologically independent experiments ± se. Mean values significantly different from 1.0 (no change) are indicated by an asterisk as determined by Student’s t tests (P < 0.05). Soybean ubiquitin (Glyma.20G141600) was used as an internal control to normalize gene expression levels.

