Figure 1.
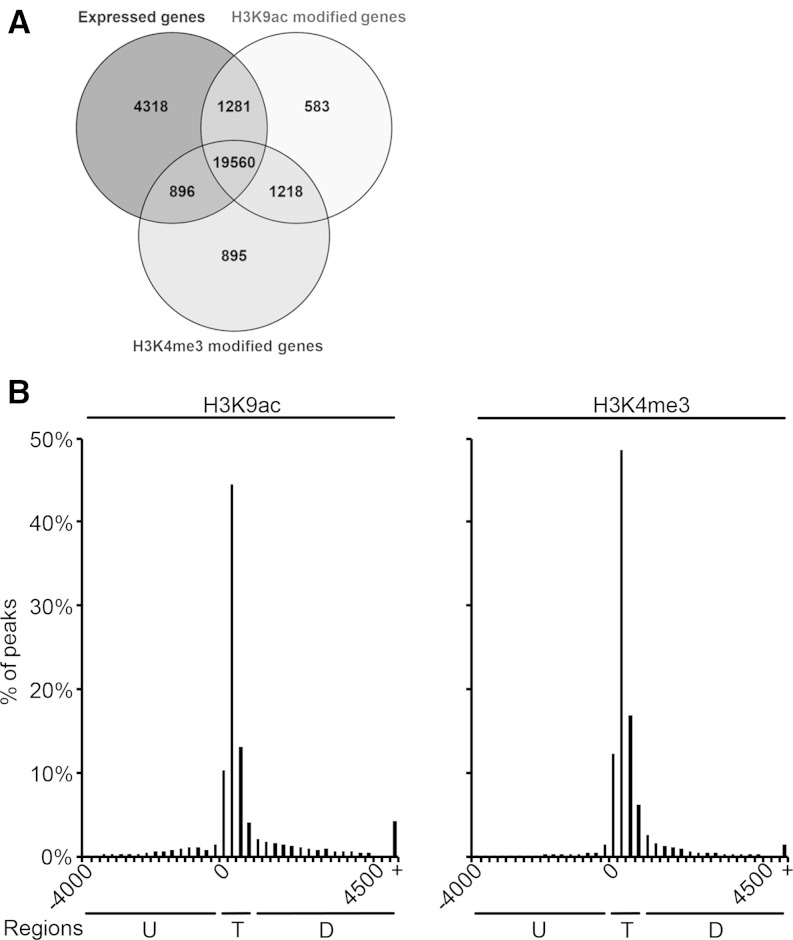
Overlap between expressed and modified genes and distribution of H3K9ac and H3K4me3 peaks. A, Overlap between expressed genes and genes modified by H3K9ac and H3K4me3. Expressed genes showed a mean RPKM > 0.1 in one of the analyzed tissues. B, Distribution relative to the TIS. H3K9ac and H3K4me3 peaks were grouped into 250-bp bins according to their position. Percentages of all peaks are plotted on the y axes. Three distinct regions are indicated: upstream (U), TIS (T), and downstream (D). +, More than 4,500 bp downstream of the TIS.

