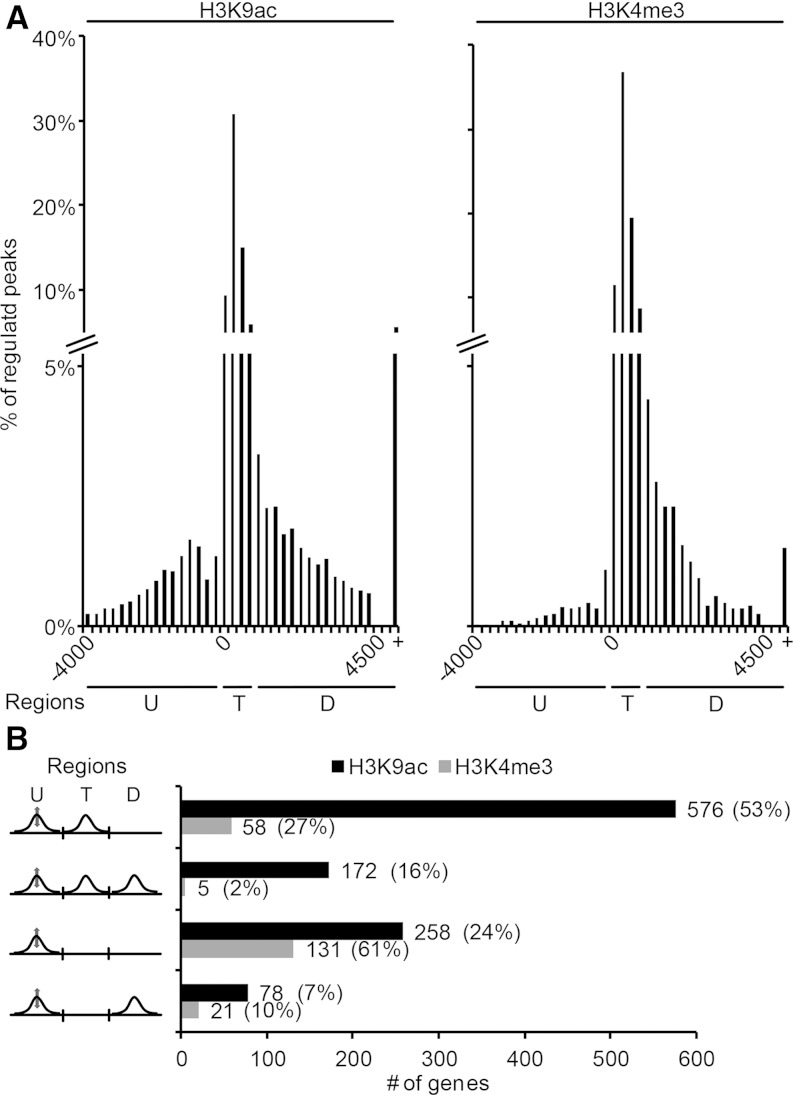
Figure 3.
Distribution of regulated H3K9ac and H3K4me3 peaks relative to the TIS and peak composition of genes with a regulated upstream peak. A, Regulated H3K9ac and H3K4me3 peaks (fold change ≥ |2|, FDR ≤ 0.05) were grouped into 250-bp bins according to their position. Percentages of all peaks were plotted on the y axes. +, More than 4,500 bp downstream of the TIS. B, Possible H3K9ac peak compositions of genes with a regulated H3K9ac upstream peak are indicated in left. The bars indicate absolute values. The fractions of the indicated composition from all genes with regulated upstream peaks are given as percentages. Three distinct regions are indicated: upstream (U), TIS (T), and downstream (D).

