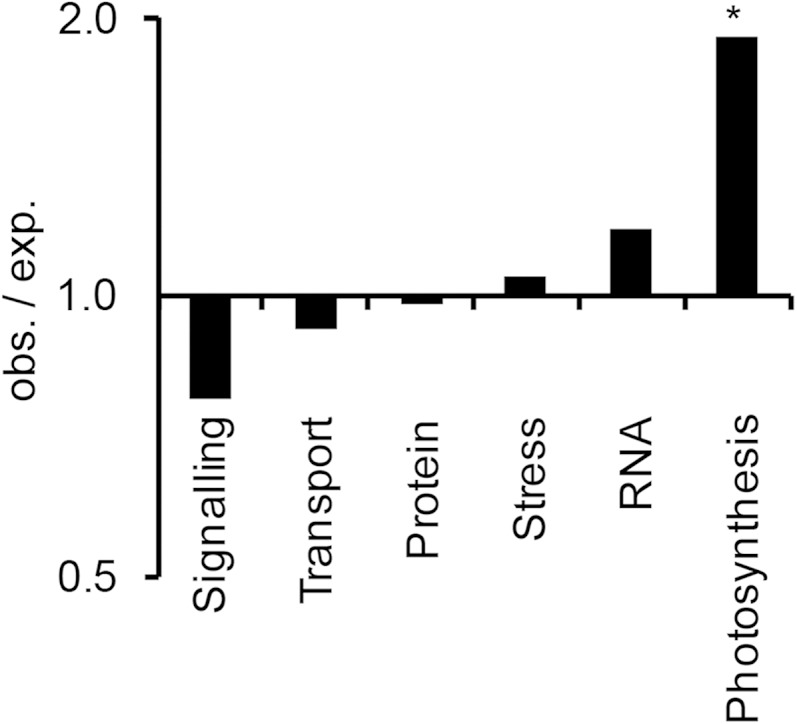
Figure 5.

Enrichment analysis of R-SUP-associated genes with induction of both transcription and R-SUP acetylation in the leaf blade compared with the base within processes defined by MapMan bins. All genes that are transcriptionally induced and linked to an induced H3K9ac peak were chosen as reference for the analysis. The degree of enrichment is given as a ratio of expected (exp.) and observed (obs.) counts (log10-transformed y axis). The significances of overrepresentations were evaluated by χ2 test, and derived P values were adjusted using the Benjamini-Hochberg correction. Processes were analyzed only if at least five counts were expected in the tested group. *, FDR ≤ 0.05.
