
Fig. 3.
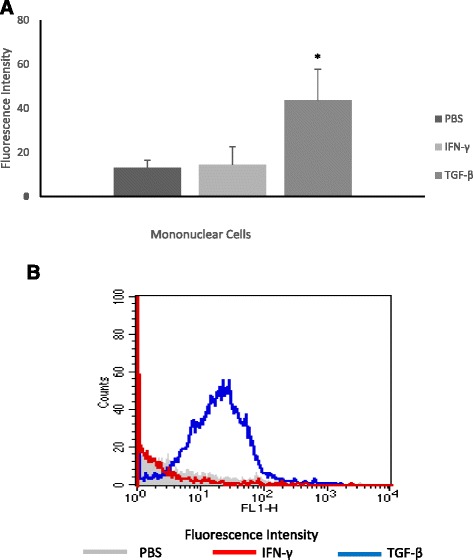
Intracellular Ca2+ release (a) by mononuclear (MN) cells indicated by geometric mean fluorescence intensity of Fluo-3. MN cells were pre-incubated with cytokines or left untreated. Intracellular Ca2+ release (b) after 2 h of incubations. *indicates statistically significant differences between MN cells incubated with cytokines and the control [PBS]. Cells were stained with Fluo-3 [Fluo3-Acetoxymethyl], and immunofluorescence analyses were carried out by flow cytometry [FACScalibur, Becton Dickinson, USA]